Settings
The Settings menu provides configuration options for Data Touch components, integrations, monitoring, risk analysis, anomaly detection, reporting, and system-level behavior.
The menu contains the following submenus:
- Data Source
- DAM
- Discovery Integration
- Risk
- Anomaly
- Report Parameters
- System Parameters
- UCMDB - Settings
- Source Settings
- Sensitive Settings
- Health Check
- Octo Integration
Use these pages to configure the corresponding Data Touch services and operational settings.
Note
Access to individual Settings pages may depend on the user's role and permissions.
Data Source
The Data Source page under Settings is used to configure data sources, supported data source types, rule templates, and bulk data source imports.
The page contains the following tabs:
- Data Source
- Data Source Type
- Rule Settings
- Excel Import
Data Source
The Data Source tab displays the data sources configured in Data Touch.
Use this page to create, search for, review, and manage data source definitions.
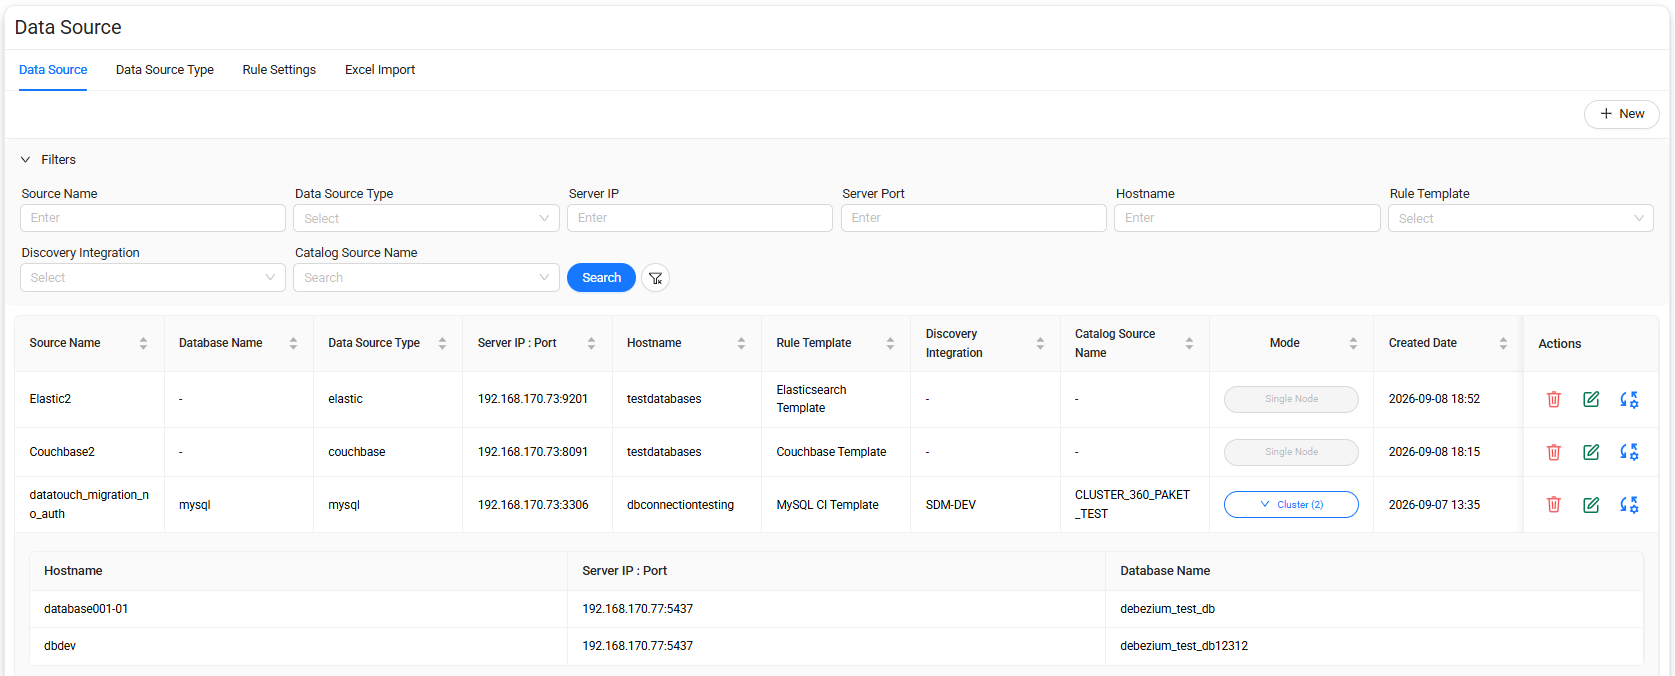
Data source list
The data source list includes the following information:
| Column | Description |
|---|---|
| Source Name | Name of the configured data source. |
| Database Name | Name of the database associated with the source. |
| Data Source Type | Type of the configured data source. |
| Server IP : Port | Server IP address and port used by the data source. |
| Hostname | Hostname associated with the data source. |
| Rule Template | Rule template assigned to the data source. |
| Discovery Integration | Discovery integration associated with the data source, if available. |
| Catalog Source Name | Catalog source associated with the data source, if available. |
| Mode | Indicates whether the data source is configured as a single node or cluster. |
| Created Date | Date and time when the data source was created. |
| Actions | Actions available for managing the data source. |
Data source mode
The Mode column indicates the topology of the configured data source.
The following modes are available:
- Single Node — Represents a data source configured with a single database node.
- Cluster — Represents a data source that contains multiple database nodes.
For clustered data sources, select the Cluster entry to expand the row and view the configured nodes.
The expanded list includes:
- Hostname
- Server IP : Port
- Database Name
Manage data sources
The Actions column provides operations for individual data sources, including:
- Delete — Deletes the selected data source.
- Edit — Opens the existing data source definition for editing.
- Add Rule - Opens the Add Rule page, where you can create and assign a rule for the selected data source.
Warning
Verify that a data source is no longer required before deleting it.
Create a data source
Select + New on the Data Source tab to open the Data Source Definition page.
Use this page to define the source type, connection settings, topology, authentication settings, and optional connection parameters.
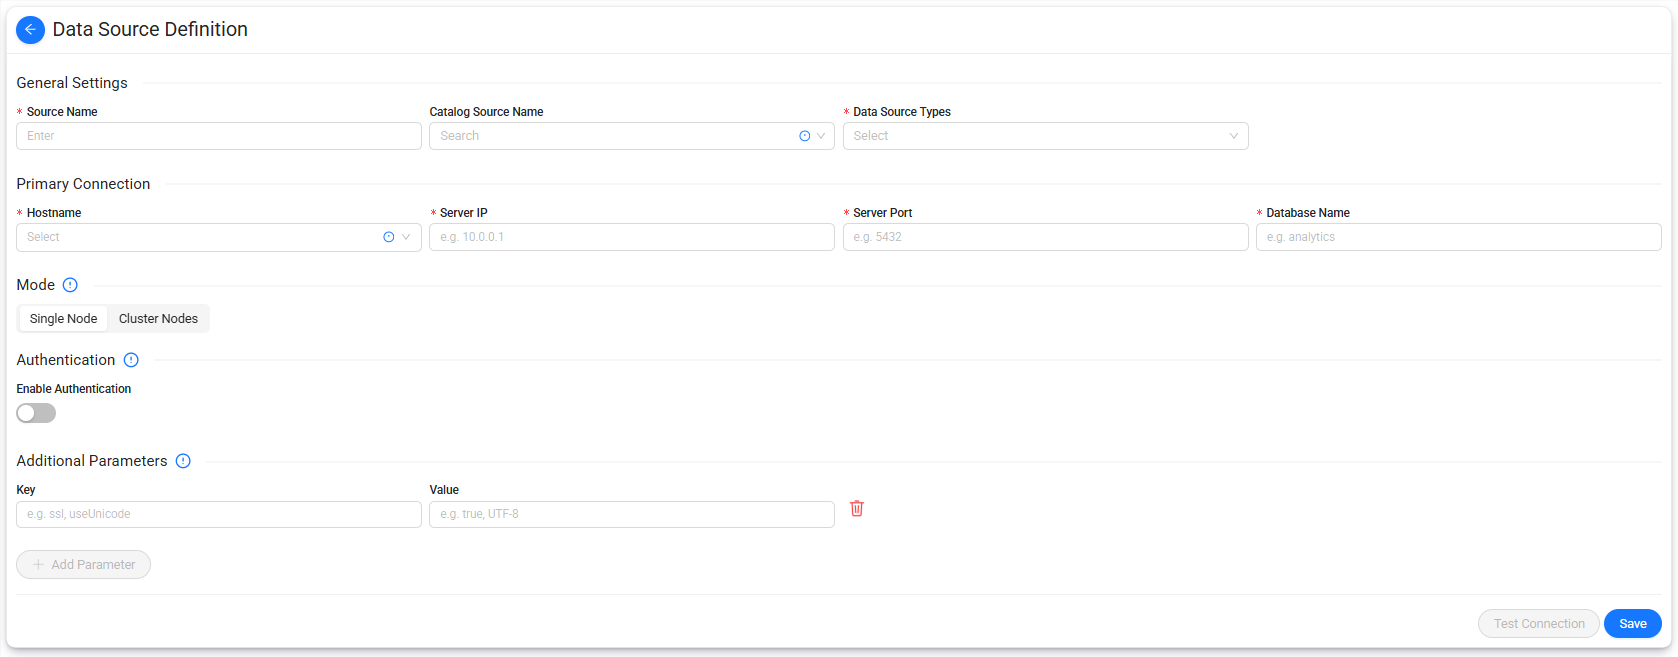
General Settings
The General Settings section identifies the data source.
| Field | Required | Description |
|---|---|---|
| Source Name | Yes | Specifies the name used to identify the data source in Data Touch. |
| Catalog Source Name | No | Associates the data source with an available catalog source. |
| Data Source Types | Yes | Specifies the database or data source type. |
Primary Connection
Use Primary Connection to configure the main database connection.
| Field | Required | Description |
|---|---|---|
| Hostname | Yes | Specifies the hostname associated with the database connection. |
| Server IP | Yes | Specifies the IP address of the database server. |
| Server Port | Yes | Specifies the port used by the database server. |
| Database Name | Yes | Specifies the database to connect to. |
Mode
Use Mode to specify the topology of the data source.
Available options are:
- Single Node
- Cluster Nodes
Select Single Node for a standalone database connection.
Select Cluster Nodes when the data source consists of multiple database nodes.
Authentication
Use Enable Authentication to specify whether authentication is required for the data source connection.
Enable this option when credentials are required to connect to the selected data source.
Additional Parameters
Use Additional Parameters to define optional connection properties as key-value pairs.
Each parameter consists of:
- Key
- Value
Examples can include connection properties such as ssl or useUnicode.
To add parameters:
- Enter the parameter name in Key.
- Enter the corresponding setting in Value.
- Select Add Parameter to add another parameter, if required.
Use the delete action next to a parameter to remove it.
Note
Additional parameters depend on the selected data source type and its connection requirements.
Test the connection
After completing the required connection settings, select Test Connection to verify that Data Touch can connect to the data source.
Resolve any connection issues before saving the definition.
Save the data source
To create a data source:
- Enter the Source Name.
- Select a Catalog Source Name, if required.
- Select the Data Source Type.
- Configure the Primary Connection.
- Select the required Mode.
- Configure authentication, if required.
- Add any required Additional Parameters.
- Select Test Connection.
- Select Save.
Data Touch creates the data source and adds it to the Data Source list.
Data Source Type
The Data Source Type tab displays the data source types supported or configured in Data Touch and their connection-format settings.
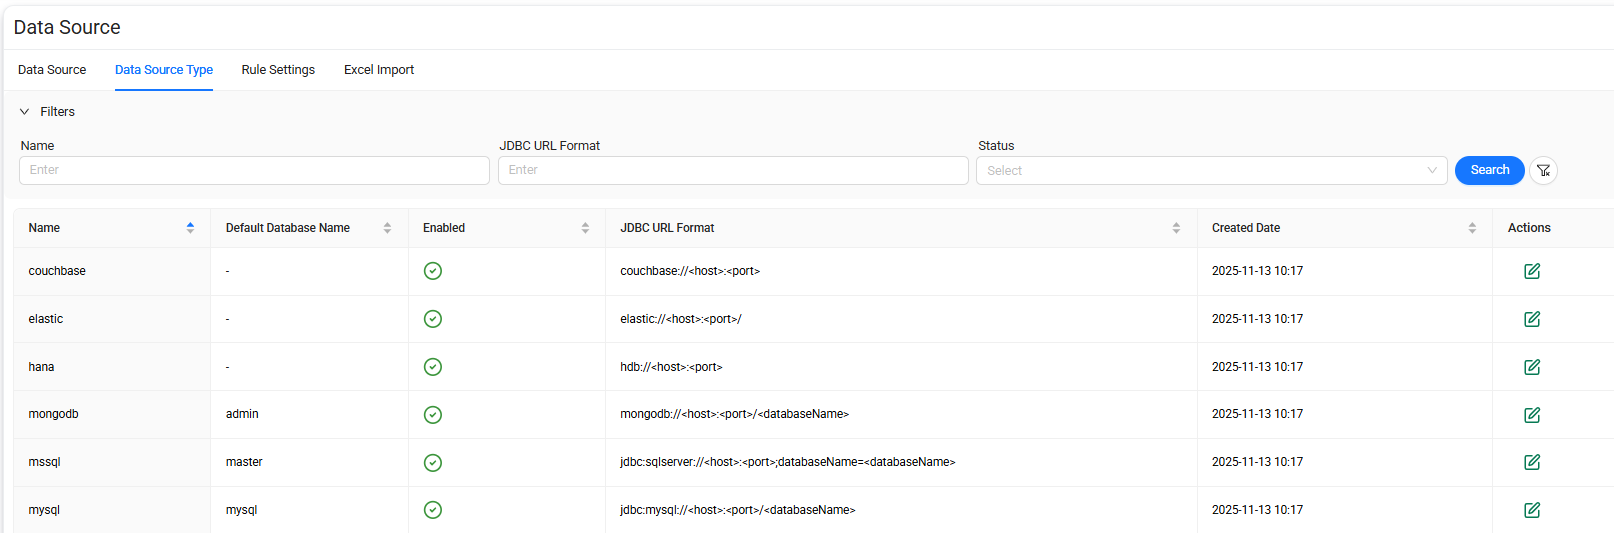
Data source type list
The list includes the following information:
| Column | Description |
|---|---|
| Name | Name of the data source type. |
| Default Database Name | Default database name associated with the data source type, if defined. |
| Enabled | Indicates whether the data source type is enabled. |
| JDBC URL Format | Connection URL format used by the data source type. |
| Created Date | Date and time when the definition was created. |
| Actions | Actions available for the data source type. |
The JDBC URL Format can contain placeholders such as host, port, or database name that are populated when a data source connection is configured.
Edit a data source type
Select Edit in the Actions column to modify the configuration of the selected data source type.
Review connection-format settings carefully before making changes because they can affect how connections for that data source type are constructed.
Rule Settings
The Rule Settings tab is used to manage rule templates associated with data source types.
These rules contain data source-specific definitions that Data Touch uses when processing identifiers or related metadata.
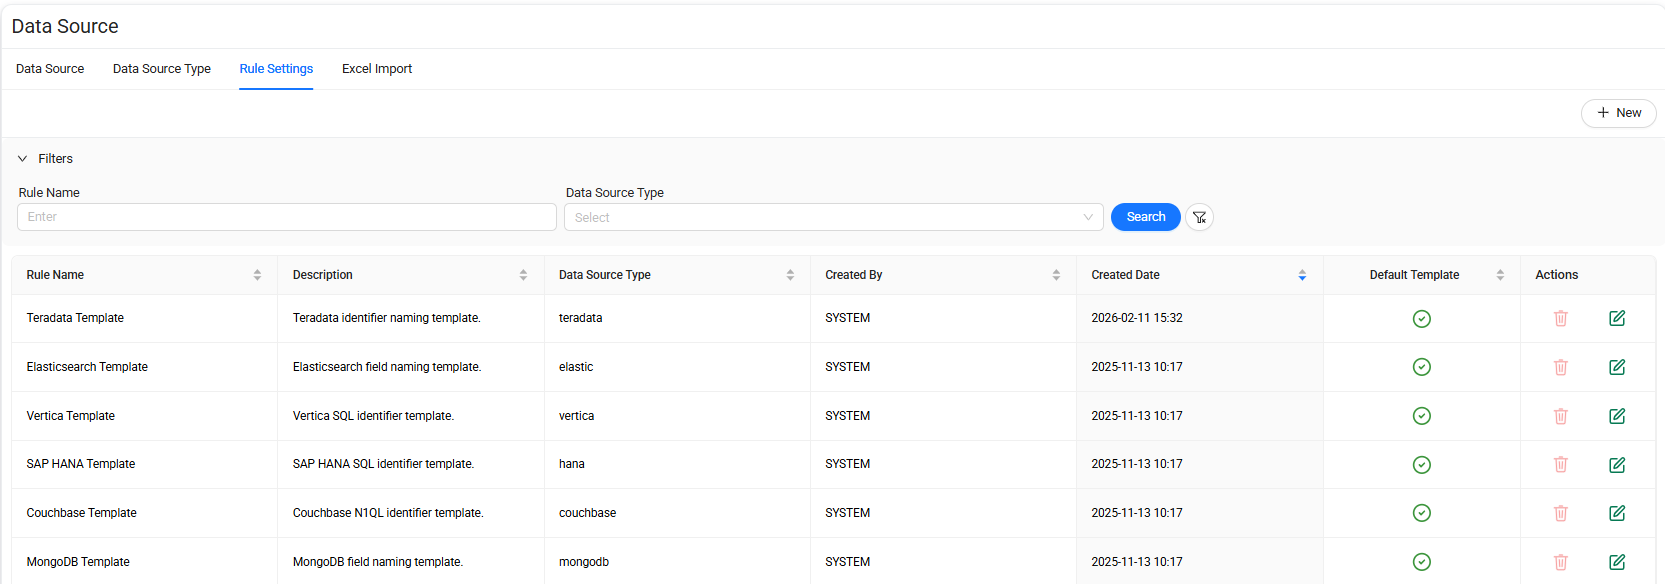
Rule list
The rule list includes the following information:
| Column | Description |
|---|---|
| Rule Name | Name of the rule template. |
| Description | Description of the rule and its intended purpose. |
| Data Source Type | Data source type associated with the rule. |
| Created By | User or system component that created the rule. |
| Created Date | Date and time when the rule was created. |
| Default Template | Indicates whether the rule is the default template for the data source type. |
| Actions | Actions available for managing the rule. |
The Actions column provides:
- Delete — Deletes the selected rule.
- Edit — Opens the rule for editing.
Warning
Changes to rule definitions can affect how Data Touch processes information for the associated data source type. Review the rule before editing or deleting it.
Create a rule
Select + New on the Rule Settings tab to open the Add Rule panel.
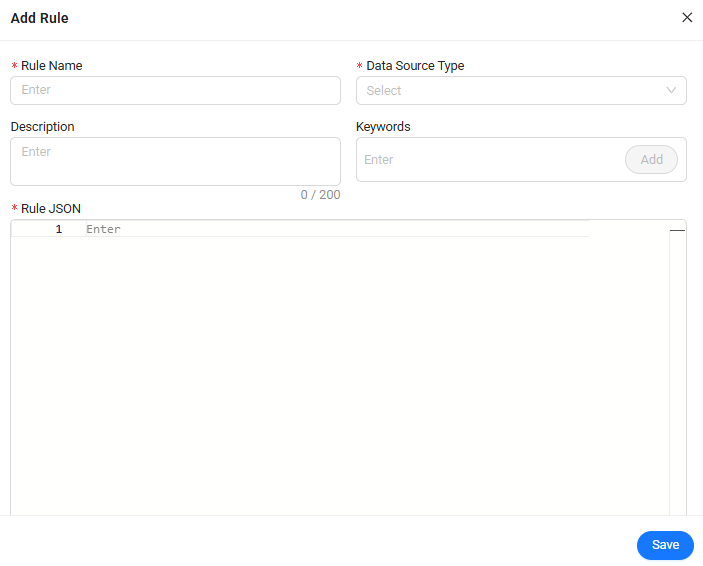
The following fields are available:
| Field | Required | Description |
|---|---|---|
| Rule Name | Yes | Specifies the name of the rule. |
| Data Source Type | Yes | Specifies the data source type to which the rule applies. |
| Description | No | Provides additional information about the rule. |
| Keywords | No | Defines keywords associated with the rule. |
| Rule JSON | Yes | Contains the JSON definition of the rule. |
To add keywords, enter a value in Keywords, and then select Add.
Enter the rule definition in Rule JSON using valid JSON syntax.
To create the rule:
- Enter a Rule Name.
- Select a Data Source Type.
- Enter a Description, if required.
- Add the required Keywords, if applicable.
- Enter the rule definition in Rule JSON.
- Select Save.
Important
Ensure that the Rule JSON contains valid and appropriate configuration for the selected data source type before saving the rule.
Excel Import
The Excel Import tab is used to import multiple data source definitions from an Excel file and review previous import executions.
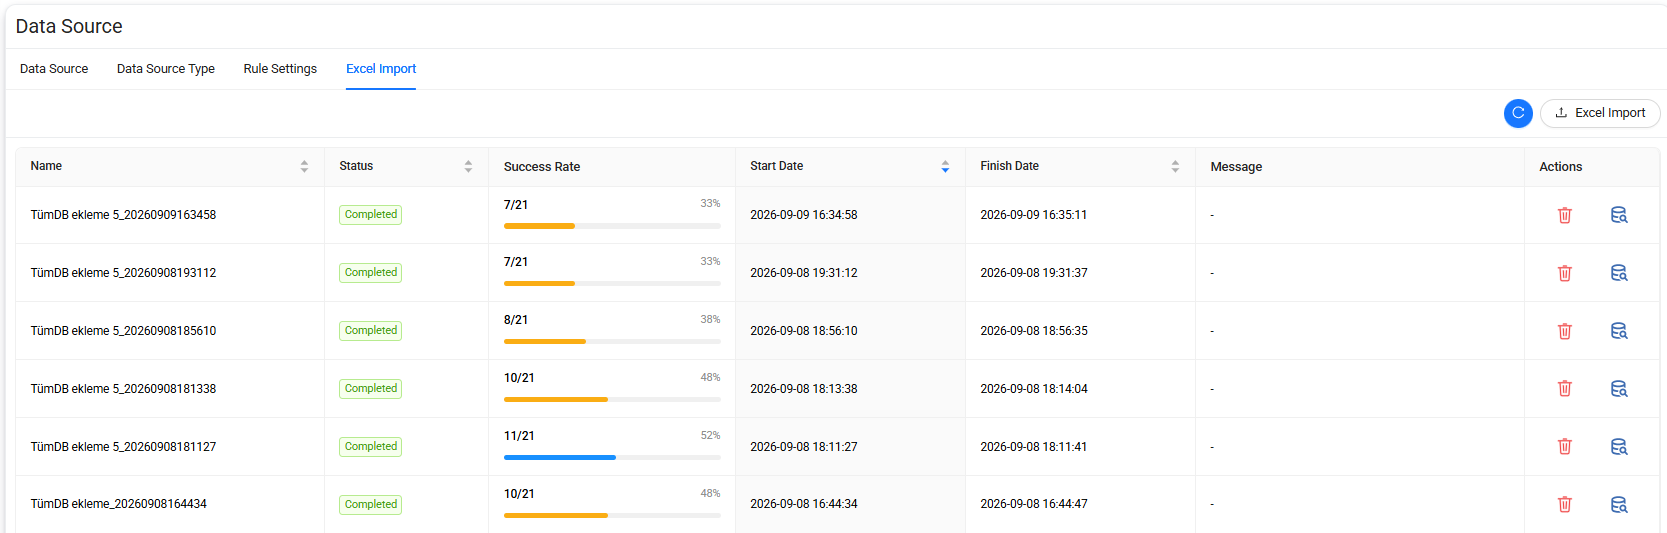
Import data sources
Select Excel Import in the upper-right corner to start a new Excel import.
After the import starts, Data Touch adds an execution record to the import list.
Import history
The list includes the following information:
| Column | Description |
|---|---|
| Name | Name of the import execution. |
| Status | Current or final status of the import. |
| Success Rate | Shows the import result as a successful-record count and percentage. |
| Start Date | Date and time when the import started. |
| Finish Date | Date and time when the import finished. |
| Message | Message associated with the import execution, if available. |
| Actions | Actions available for the import record. |
A Completed status indicates that processing of the Excel import has finished. Review the Success Rate to determine how many records were processed successfully.
Note
A completed import does not necessarily mean that every record was imported successfully. Review the Success Rate and import details to identify unsuccessful records.
Import actions
The Actions column provides operations for each import execution.
Available actions include:
- Delete — Deletes the selected import-history record.
- Details — Opens the results or details associated with the selected import execution.
Use the details view when the Success Rate indicates that one or more records were not imported successfully.
Refresh import status
Select the Refresh button to update the import list and retrieve the latest execution status.
DAM
The DAM page under Settings is used to configure Database Activity Monitoring (DAM) categories and action types.
The page contains the following tabs:
- Category
- Action Type
Category
The Category tab is used to create and manage categories assigned to database activities.
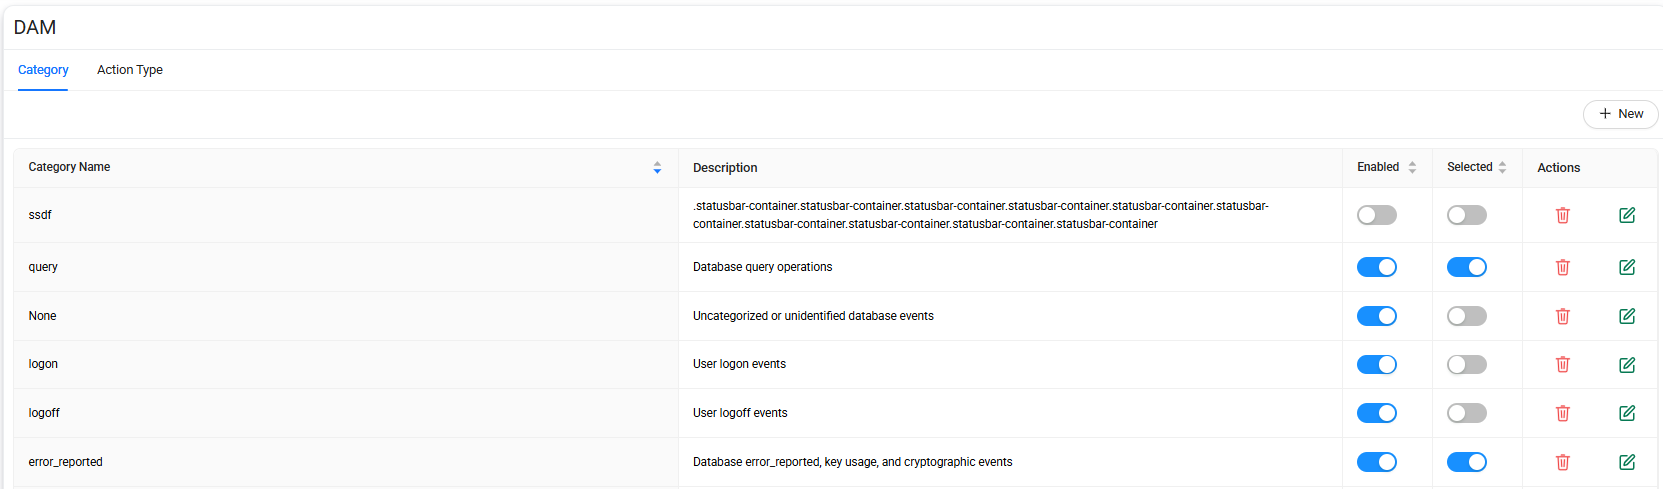
The category list includes the following information:
| Column | Description |
|---|---|
| Category Name | Name of the DAM category. |
| Description | Description of the category and the type of activity it represents. |
| Enabled | Indicates whether the category is enabled. |
| Selected | Indicates whether the category is marked as selected. |
| Actions | Provides actions for managing the category. |
Examples of categories can include database query activity, user logon and logoff events, database errors, or uncategorized events.
Enable or disable a category
Use the Enabled toggle to enable or disable a category.
- Enabled categories are available for DAM processing.
- Disabled categories remain configured but are not enabled for use.
Select a category
Use the Selected toggle to change the selected state of the category.
The current state is displayed directly in the category list.
Category actions
The Actions column provides the following operations:
- Delete — Deletes the selected category.
- Edit — Opens the category definition for editing.
Warning
Verify that a category is no longer required before deleting it.
Create a category
Select + New on the Category tab to open the New Category page.
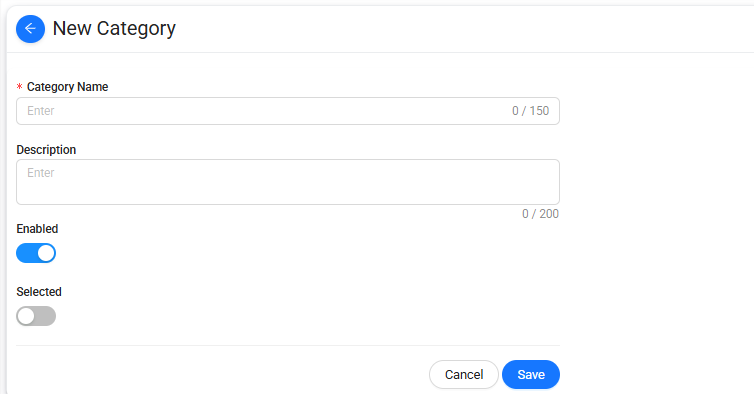
The following fields are available:
| Field | Description |
|---|---|
| Category Name | Specifies the name of the category. The name can contain up to 150 characters. |
| Description | Provides information about the purpose of the category. The description can contain up to 200 characters. |
| Enabled | Determines whether the category is enabled. |
| Selected | Determines whether the category is marked as selected. |
To create a category:
- Enter a Category Name.
- Enter a Description, if required.
- Configure Enabled.
- Configure Selected.
- Select Save.
Select Cancel to return without creating the category.
Action Type
The Action Type tab is used to review and configure database action types processed by DAM.
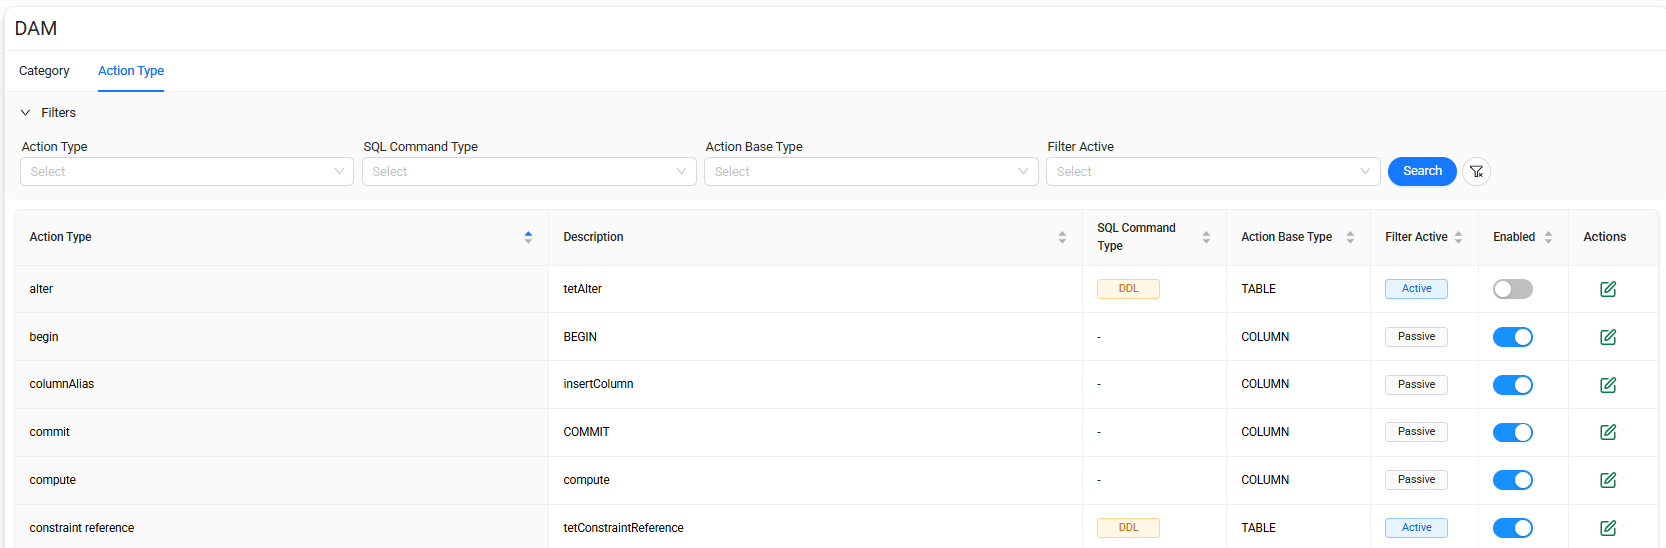
Action type list
The list includes the following information:
| Column | Description |
|---|---|
| Action Type | Name of the database action. |
| Description | Description associated with the action type. |
| SQL Command Type | SQL command classification associated with the action, when applicable. |
| Action Base Type | Base object or activity type associated with the action. |
| Filter Active | Indicates whether filtering is active for the action type. |
| Enabled | Indicates whether the action type is enabled. |
| Actions | Provides actions for managing the action type. |
SQL Command Type
The SQL Command Type column identifies the SQL classification of an action when applicable.
For example, an action such as alter can be classified as DDL.
If no SQL command classification is assigned, the field is displayed as -.
Action Base Type
The Action Base Type column identifies the base entity associated with the action.
Examples shown in the configuration can include:
- TABLE
- COLUMN
Filter Active
The Filter Active column shows whether filtering is enabled for the corresponding action type.
The status can be displayed as:
- Active
- Passive
Enable or disable an action type
Use the Enabled toggle to enable or disable the corresponding DAM action type.
The toggle allows the action type configuration to remain defined while controlling whether it is enabled.
Edit an action type
Select Edit in the Actions column to modify the configuration of the selected action type.
Review the existing settings, make the required changes, and save the configuration.
Discovery Integration
The Discovery Integration page under Settings is used to configure and manage integrations that provide discovery data to Data Touch.
Discovery integrations can run according to a configured schedule or be started manually.
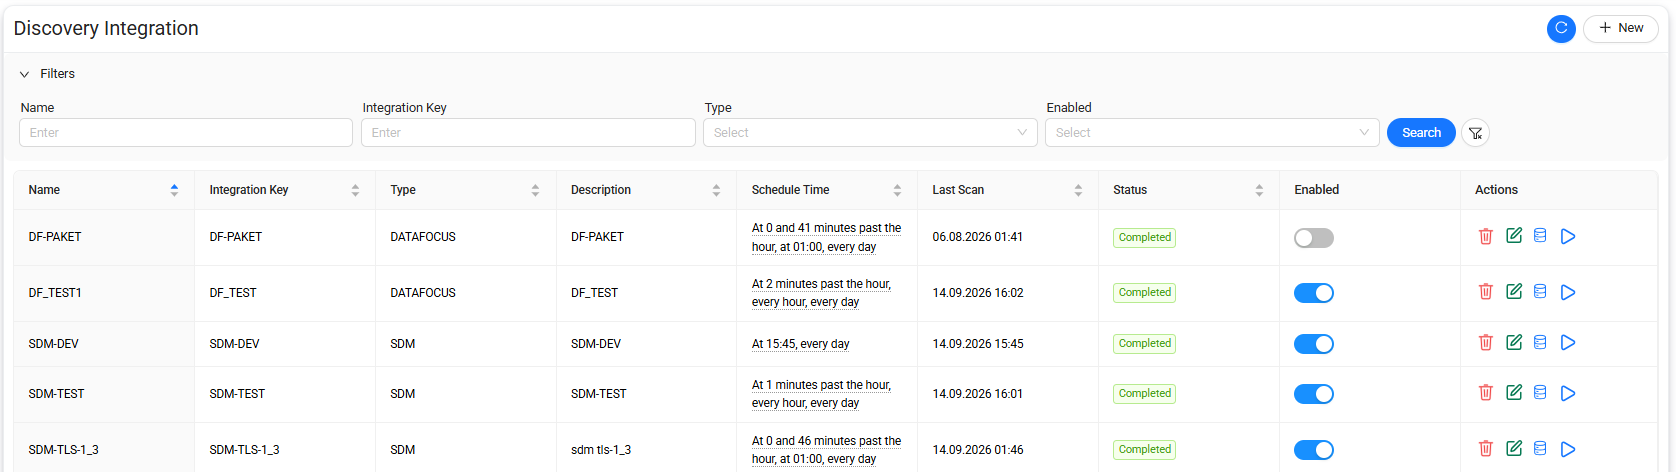
Discovery Integration list
The list includes the following information:
| Column | Description |
|---|---|
| Name | Name of the Discovery integration. |
| Integration Key | Key used to identify the integration. |
| Type | Type of the Discovery integration. |
| Description | Description of the integration. |
| Schedule Time | Schedule configured for automatic execution. |
| Last Scan | Date and time of the most recent scan. |
| Status | Current or most recent execution status of the integration. |
| Enabled | Indicates whether the integration is enabled. |
| Actions | Actions available for managing and running the integration. |
Enable or disable an integration
Use the Enabled toggle to enable or disable a Discovery integration.
- Enabled — The integration is available for scheduled or manual execution.
- Disabled — The integration remains configured but is disabled.
Refresh the integration list
Select the Refresh button in the upper-right corner to update the displayed integration information.
Use this option to retrieve the latest execution status and scan information.
Discovery Integration actions
The Actions column provides the following operations for each integration:
- Delete
- Edit
- Data Source
- Run
Delete an integration
Select Delete to remove the selected Discovery integration.
Warning
Verify that the integration is no longer required before deleting it.
Edit an integration
Select Edit to open the existing Discovery integration definition.
Modify the required settings, and then save the configuration.
View Data Sources
Select Data Source to access data source information associated with the selected Discovery integration.
Use this action to review the data sources related to the integration.
Run an integration
Select Run to start the selected Discovery integration manually.
Data Touch starts a discovery scan using the integration's current configuration.
After execution, the Last Scan and Status values are updated to reflect the latest scan information.
Create a Discovery Integration
Select + New on the Discovery Integration page to open the Discovery Integration Definition page.
Use this page to configure the integration identity, type, execution schedule, additional parameters, and advanced settings.
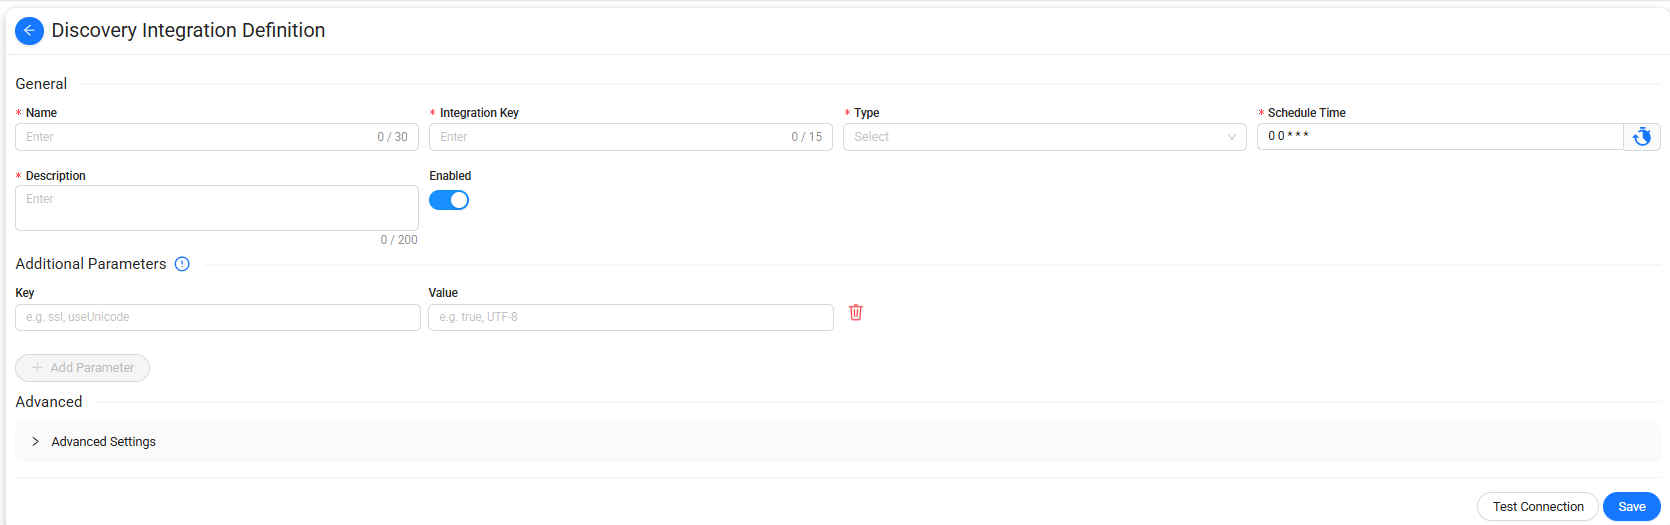
General
The General section contains the primary integration settings.
| Field | Description |
|---|---|
| Name | Specifies the name of the Discovery integration. The name can contain up to 30 characters. |
| Integration Key | Specifies the key used to identify the integration. The key can contain up to 15 characters. |
| Type | Specifies the Discovery integration type. |
| Schedule Time | Specifies when the integration runs automatically. |
| Description | Provides information about the integration. The description can contain up to 200 characters. |
| Enabled | Determines whether the integration is enabled after it is saved. |
Schedule Time
Use Schedule Time to configure the automatic execution schedule for the Discovery integration.
The configured schedule is displayed in the Schedule Time column on the Discovery Integration list.
For example, a schedule can be configured to run:
- At a specific time every day.
- At specific minutes within each hour.
- At another interval supported by the schedule configuration.
Additional Parameters
Use Additional Parameters to define optional integration-specific settings as key-value pairs.
Each parameter consists of:
- Key
- Value
To add a parameter:
- Enter the parameter name in Key.
- Enter the corresponding value in Value.
- Select Add Parameter to add another parameter, if required.
Use the delete action next to a parameter to remove it.
Note
Required additional parameters depend on the selected integration type and its configuration requirements.
Advanced Settings
Expand Advanced Settings to configure additional options for the Discovery integration.
The available settings can vary depending on the selected integration type.
Test the connection
After completing the required integration settings, select Test Connection to verify that Data Touch can connect to the configured integration.
Resolve any connection issues before saving the definition.
Save the integration
To create a Discovery integration:
- Enter a Name.
- Enter an Integration Key.
- Select a Type.
- Configure the Schedule Time.
- Enter a Description.
- Configure Enabled as required.
- Add any required Additional Parameters.
- Configure Advanced Settings, if required.
- Select Test Connection.
- Select Save.
Data Touch creates the integration and adds it to the Discovery Integration list.
Risk
The Risk page under Settings is used to configure risk calculation, risk rules, risk labels, system-level risk processes, and parameters used by the risk assessment module.
The page contains the following tabs:
- Data Source
- Users
- Data Source Risk
- User Risk
- Risk Label
- System
- Parameters
- Parameter Assignment
Data Source
The Data Source tab determines which data sources are included in risk score calculation.
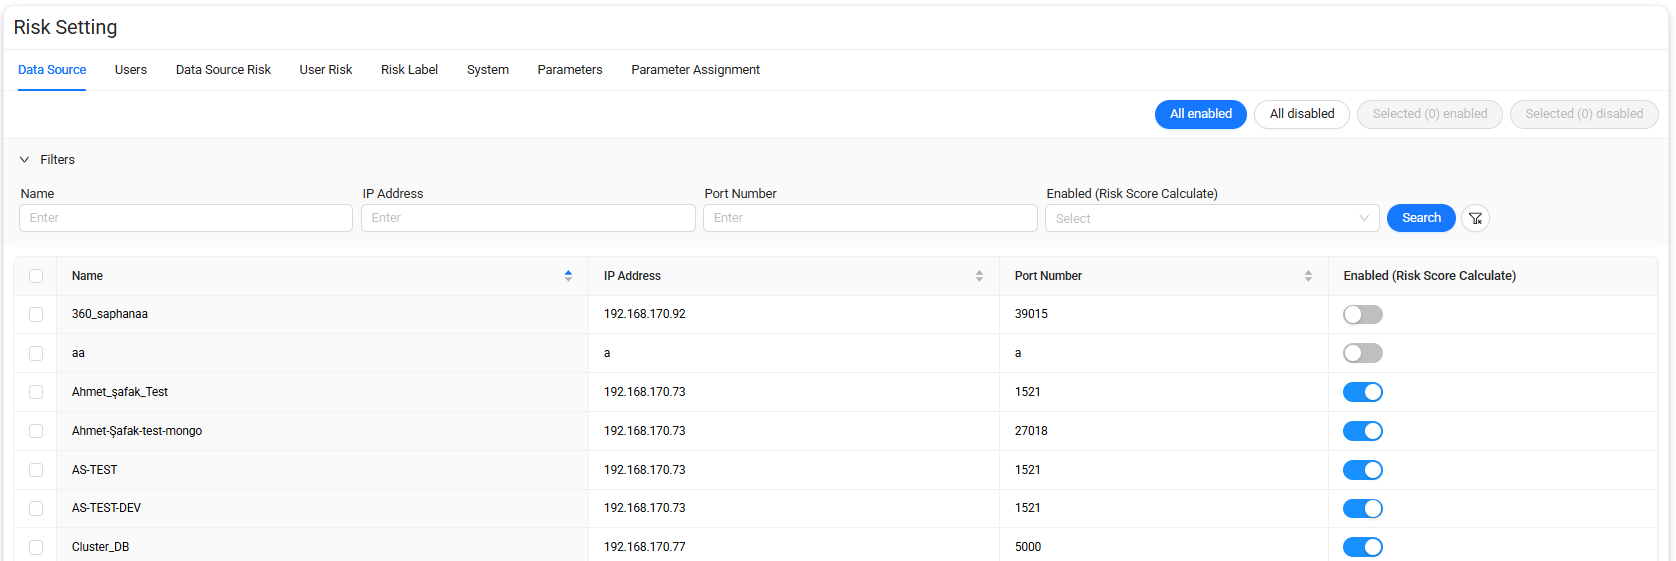
Data source list
The list includes the following information:
| Column | Description |
|---|---|
| Name | Name of the data source. |
| IP Address | IP address associated with the data source. |
| Port Number | Port used by the data source. |
| Enabled (Risk Score Calculate) | Indicates whether the data source is included in risk score calculation. |
Enable risk score calculation
Use the toggle in Enabled (Risk Score Calculate) to include or exclude an individual data source from risk score calculation.
You can also use the bulk actions at the top of the page:
- All enabled — Enables risk score calculation for all data sources.
- All disabled — Disables risk score calculation for all data sources.
- Selected enabled — Enables risk score calculation for the selected data sources.
- Selected disabled — Disables risk score calculation for the selected data sources.
Use the checkboxes in the first column to select individual records before using the selected-record actions.
Users
The Users tab determines which database users are included in user risk score calculation.
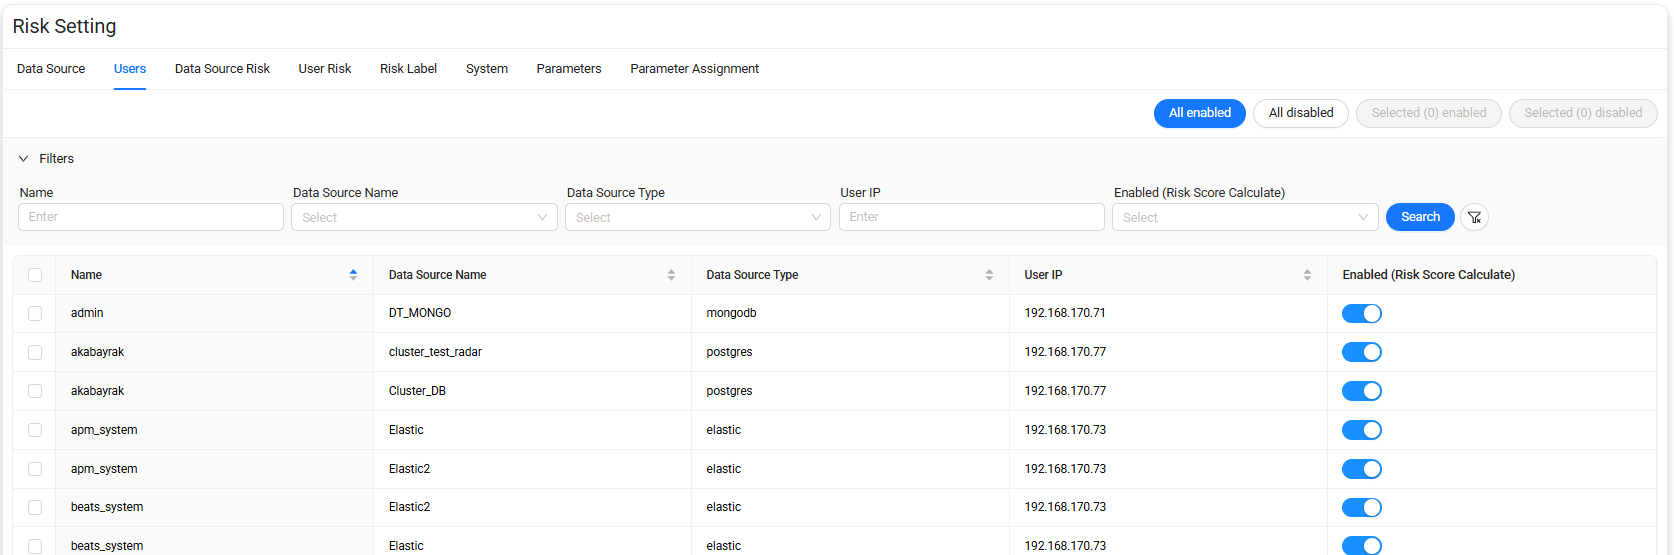
User list
The list includes the following information:
| Column | Description |
|---|---|
| Name | Name of the database user. |
| Data Source Name | Data source associated with the user. |
| Data Source Type | Type of the associated data source. |
| User IP | IP address associated with the user activity. |
| Enabled (Risk Score Calculate) | Indicates whether the user is included in risk score calculation. |
Enable user risk score calculation
Use the Enabled (Risk Score Calculate) toggle to include or exclude an individual user from risk score calculation.
The following bulk actions are also available:
- All enabled
- All disabled
- Selected enabled
- Selected disabled
Use the checkboxes to select records before applying an action to selected users.
Data Source Risk
The Data Source Risk tab contains the risk rules used to calculate risk for data sources.
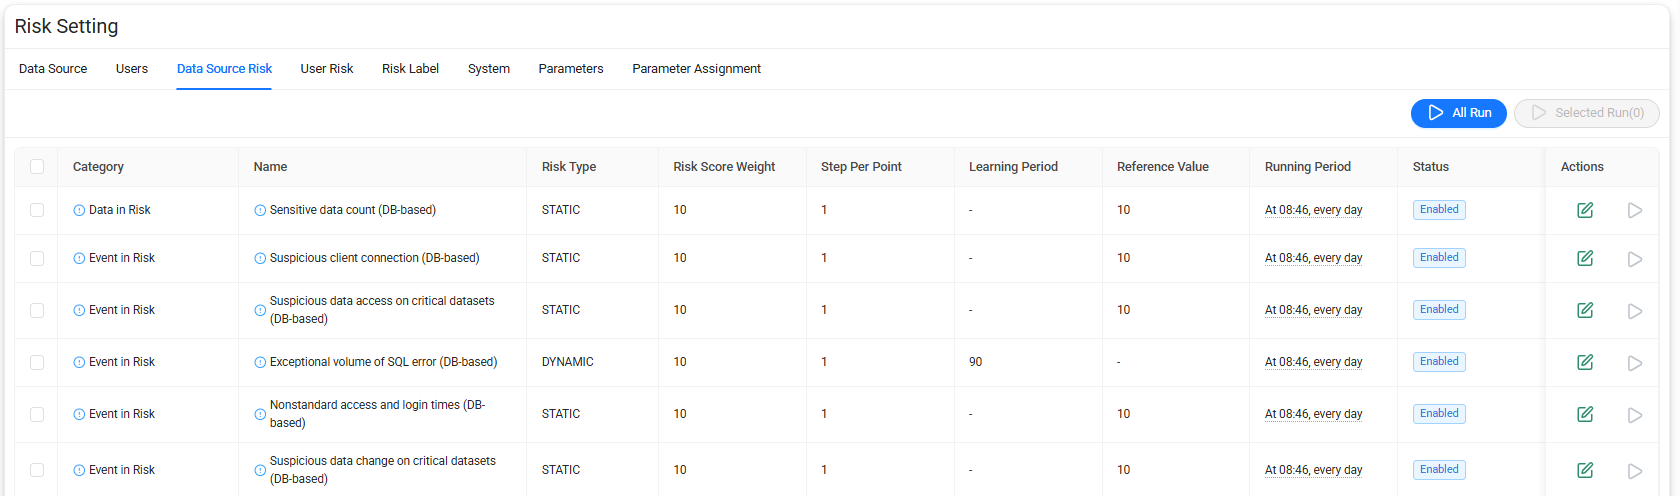
The list includes the following information:
| Column | Description |
|---|---|
| Category | Risk category associated with the rule. |
| Name | Name of the data source risk rule. |
| Risk Type | Indicates whether the rule uses a static or dynamic risk calculation. |
| Risk Score Weight | Weight applied to the rule when calculating the risk score. |
| Step Per Point | Defines the step used when converting the rule result into risk points. |
| Learning Period | Learning period used by the rule, when applicable. |
| Reference Value | Reference value used by the rule, when applicable. |
| Running Period | Schedule configured for automatic execution. |
| Status | Current status of the risk rule. |
| Actions | Actions available for configuring or running the rule. |
Risk types
The Risk Type column can include:
- STATIC — Uses configured values or thresholds for risk evaluation.
- DYNAMIC — Uses a learning period or dynamically derived information for risk evaluation.
Note
The fields used by a rule can vary according to its risk type. For example, a dynamic rule can use a Learning Period, while a static rule can use a Reference Value.
Risk rule categories
Data source risk rules can be grouped into categories such as:
- Data in Risk
- Event in Risk
- Policy in Risk
- User in Risk
The category identifies the type of risk represented by the rule.
Run risk rules
Two execution options are available:
- All Run — Runs all data source risk rules.
- Selected Run — Runs only the rules selected in the list.
To run specific rules:
- Select the required rules using the checkboxes.
- Select Selected Run.
Data Source Risk actions
The Actions column provides the following operations:
- Edit — Opens the selected risk rule for editing.
- Run — Runs the selected risk rule manually.
User Risk
The User Risk tab contains the risk rules used to calculate user-related risk.
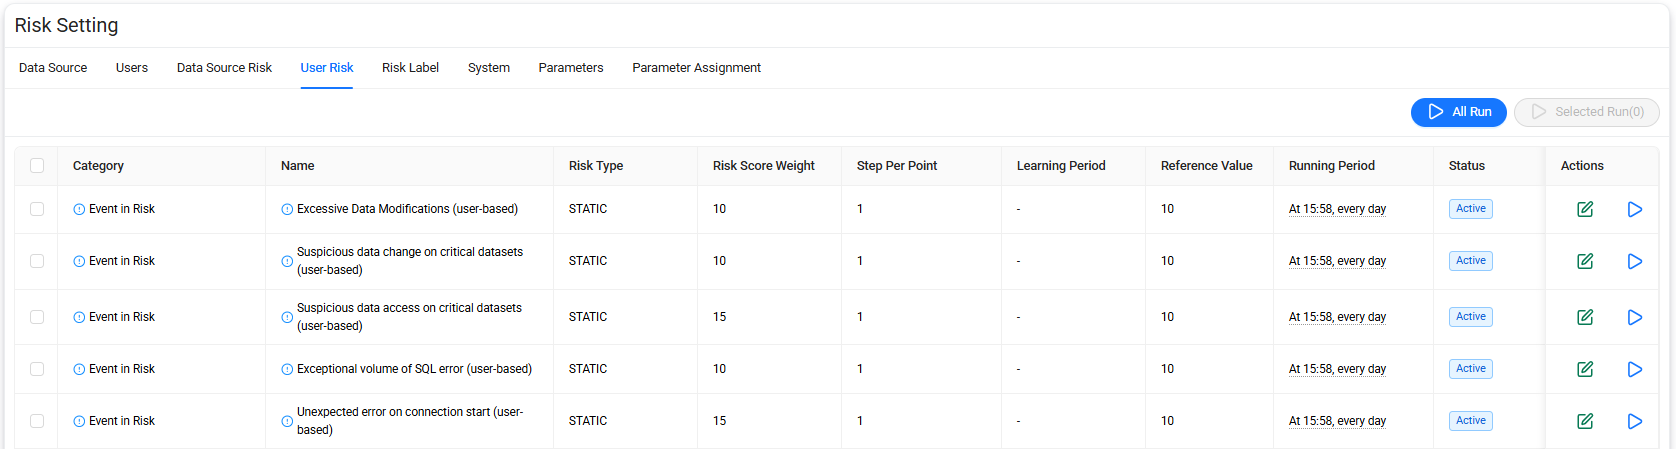
The list includes the following information:
| Column | Description |
|---|---|
| Category | Risk category associated with the rule. |
| Name | Name of the user risk rule. |
| Risk Type | Indicates the risk calculation type. |
| Risk Score Weight | Weight applied to the rule during risk score calculation. |
| Step Per Point | Defines the step used when converting the rule result into risk points. |
| Learning Period | Learning period used by the rule, when applicable. |
| Reference Value | Reference value used by the rule, when applicable. |
| Running Period | Schedule configured for automatic execution. |
| Status | Current status of the rule. |
| Actions | Actions available for configuring or running the rule. |
User risk rules can represent categories such as:
- Event in Risk
- Privilege in Risk
- User in Risk
Examples include excessive data modifications, suspicious access to critical data, repeated failed logins, and privilege-related conditions.
Run User Risk rules
Use:
- All Run to run all user risk rules.
- Selected Run to run only the selected rules.
The Actions column also provides:
- Edit
- Run
Risk Label
The Risk Label tab defines the score ranges used to classify calculated risk levels.
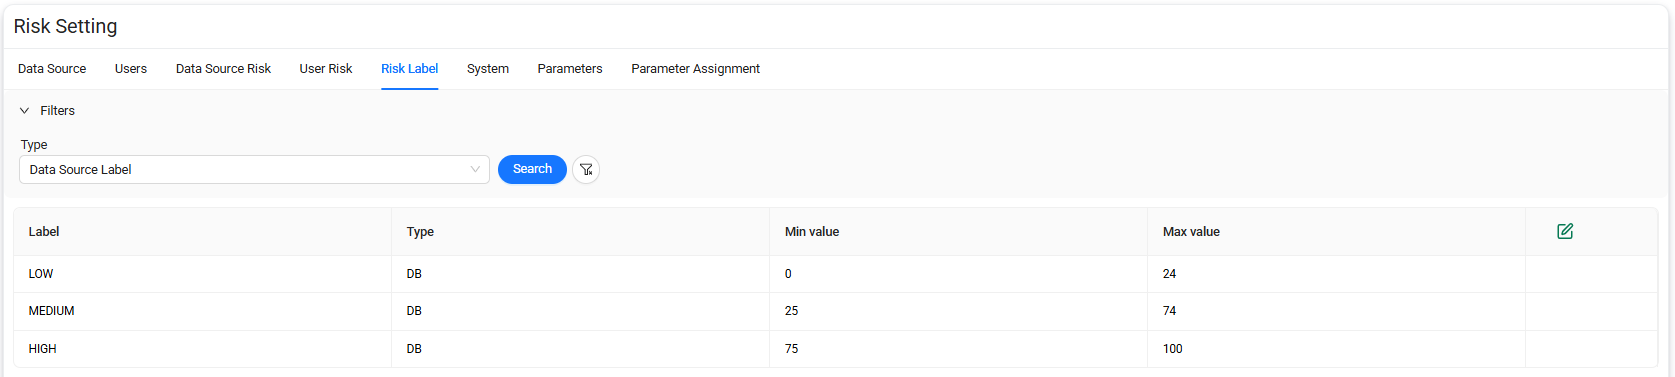
Risk Label list
The list includes:
| Column | Description |
|---|---|
| Label | Name of the risk classification. |
| Type | Type of risk object to which the label applies. |
| Min value | Minimum risk score included in the label. |
| Max value | Maximum risk score included in the label. |
| Actions | Provides access to the label configuration. |
Risk labels can include levels such as:
- LOW
- MEDIUM
- HIGH
The configured minimum and maximum values determine which label is assigned to a calculated risk score.
Edit Risk Labels
Select Edit to modify the configured score ranges.
Important
Configure the ranges so that required risk scores are classified consistently and without unintended gaps or overlaps.
System
The System tab contains scheduled system processes used by the Risk module.
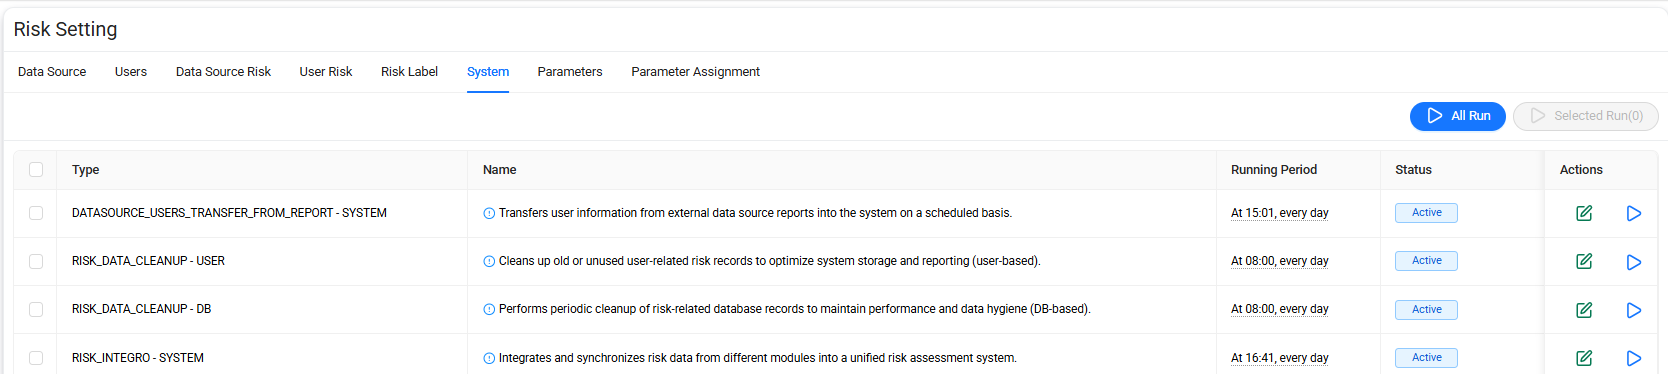
The list includes:
| Column | Description |
|---|---|
| Type | Technical identifier of the system process. |
| Name | Description of the operation performed by the process. |
| Running Period | Schedule configured for automatic execution. |
| Status | Current status of the process. |
| Actions | Actions available for configuring or running the process. |
System processes can perform operations such as:
- Transferring user information from data source reports.
- Cleaning up historical risk data.
- Integrating risk information from different modules.
- Calculating data source risk scores.
- Calculating user risk scores.
Run system processes
Use:
- All Run to run all system processes.
- Selected Run to run only selected processes.
Select the checkbox next to each required process before using Selected Run.
System actions
The Actions column provides:
- Edit — Opens the process configuration.
- Run — Starts the selected process manually.
Parameters
The Parameters tab is used to define reusable parameters used by risk rules.
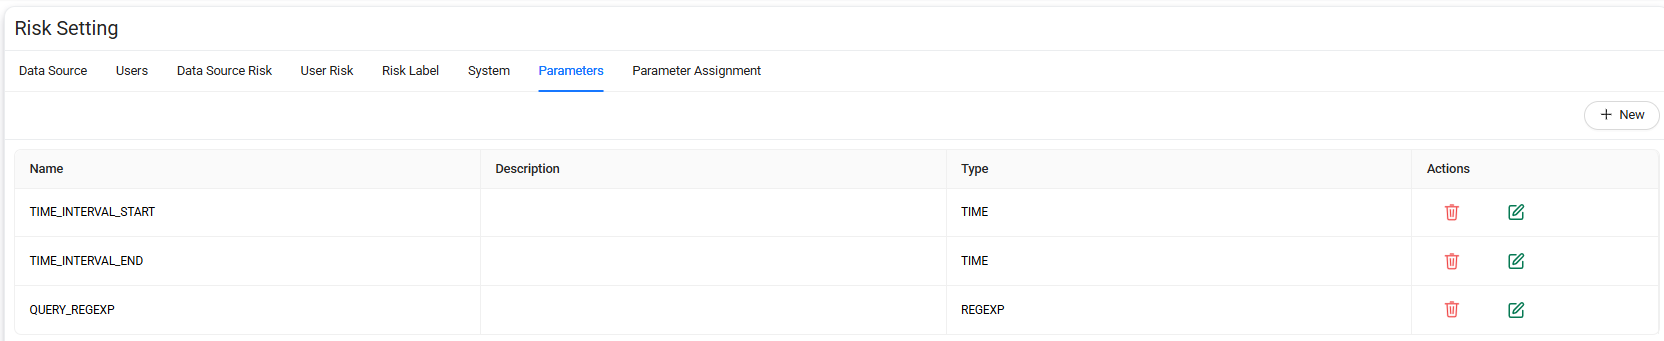
The list includes:
| Column | Description |
|---|---|
| Name | Name of the parameter. |
| Description | Description of the parameter. |
| Type | Data or parameter type. |
| Actions | Actions available for managing the parameter. |
Examples of parameter types can include:
- TIME
- REGEXP
Parameter actions
The Actions column provides:
- Delete
- Edit
Warning
Verify that a parameter is not required by an existing risk configuration before deleting it.
Create a parameter
Select + New to open the New Parameter page.
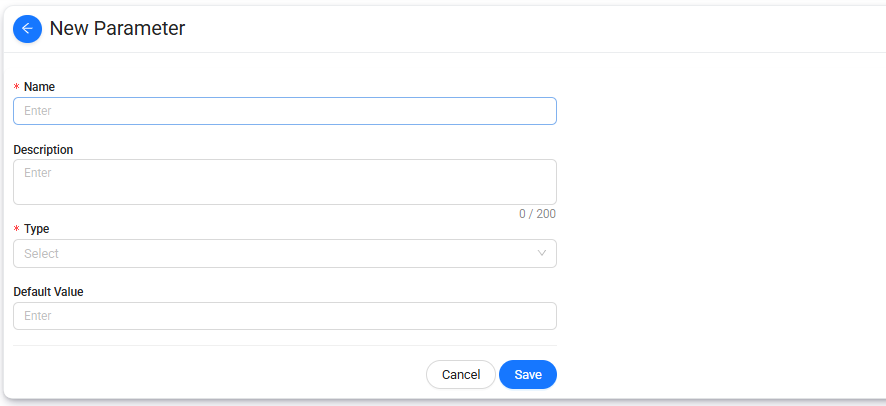
The following fields are available:
| Field | Description |
|---|---|
| Name | Specifies the parameter name. |
| Description | Provides additional information about the parameter. The description can contain up to 200 characters. |
| Type | Specifies the parameter type. |
| Default Value | Specifies the default value assigned to the parameter. |
To create a parameter:
- Enter a Name.
- Enter a Description, if required.
- Select a Type.
- Enter a Default Value, if required.
- Select Save.
Select Cancel to return without creating the parameter.
Parameter Assignment
The Parameter Assignment tab displays risk rules that can use configurable risk parameters.

The list includes:
| Column | Description |
|---|---|
| Category | Risk category associated with the rule. |
| Description | Description of the risk rule. |
| Risk Type | Risk calculation type, such as STATIC or DYNAMIC. |
| Status | Current status of the rule. |
| Actions | Provides access to parameter assignment when available. |
Assign parameters
When parameter configuration is available for a risk rule, an assignment action is displayed in the Actions column.
Select the parameter assignment action to configure the parameters used by the corresponding risk rule.
Only rules that require configurable parameters display this action.
Note
Parameters must first be defined under the Parameters tab before they can be used in risk rule parameter assignments.
Anomaly
The Anomaly page under Settings is used to manage scheduled background jobs related to anomaly and ledger alert notifications.
The page contains the following tab:
- Auto Job
Auto Job
The Auto Job tab displays scheduled background jobs and their current configuration.

The list includes the following information:
| Column | Description |
|---|---|
| Name | Technical name of the scheduled job. |
| Description | Describes the function performed by the job. |
| Last Generation Time | Date and time when the job last generated or processed its scheduled output. |
| Schedule Time | Schedule configured for automatic execution. |
| Status | Current status of the scheduled job. |
| Actions | Actions available for managing the job. |
Auto Job types
The configured jobs can include processes such as:
- LEDGER_ALERT_MAIL_SCHEDULER — Sends ledger alert email notifications at configured intervals.
- ANOMALY_ALERT_MAIL_SCHEDULER — Sends anomaly alert email notifications at configured intervals.
Schedule Time
The Schedule Time column shows when each job runs automatically.
The schedule can define recurring execution patterns such as:
- Every specified number of minutes.
- At a specific minute of each hour.
- Other configured recurring intervals.
For example, a schedule can be displayed as:
Every 5 minutes, every hour, every day
Last Generation Time
The Last Generation Time column shows the most recent execution or generation time recorded for the corresponding job.
Use this information together with Schedule Time and Status to verify that the job is running according to its configured schedule.
Status
The Status column shows whether the scheduled job is currently active.
An Active status indicates that the job is enabled.
Edit an Auto Job
Select Edit in the Actions column to modify the configuration of the selected scheduled job.
Use this option to update available job settings, such as its execution schedule.
After making the required changes, save the configuration to apply them.
Report Parameters
The Report Parameters page under Settings is used to define reusable report parameters, review their report and data source assignments, and manage scheduled background jobs related to report generation and maintenance.
The page contains the following tabs:
- Parameters
- Assignment
- Auto Job
Parameters
The Parameters tab is used to create and manage reusable parameters that can be used by report configurations.
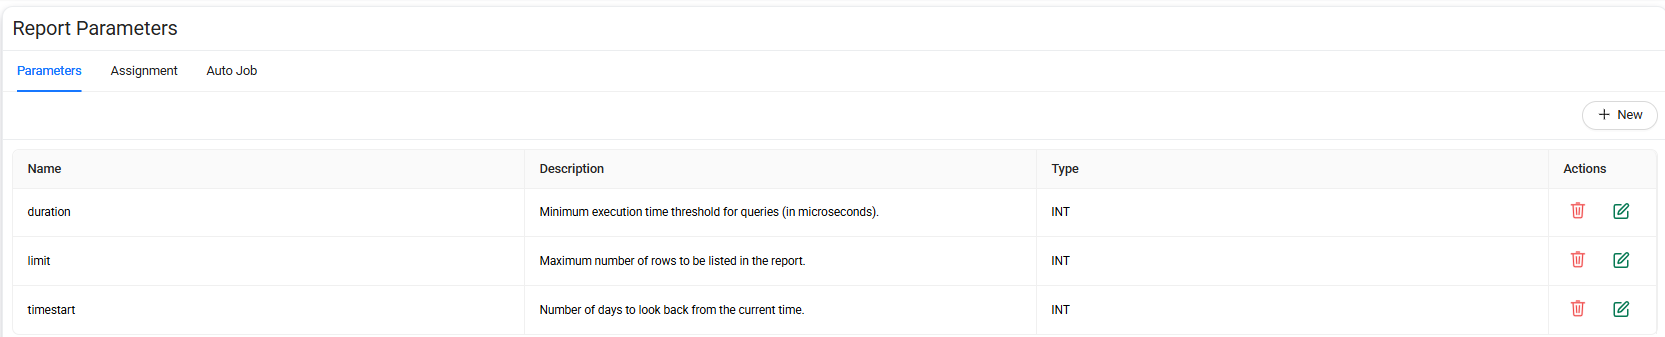
The parameter list includes the following information:
| Column | Description |
|---|---|
| Name | Name of the report parameter. |
| Description | Description of the parameter and its intended use. |
| Type | Data type of the parameter. |
| Actions | Actions available for managing the parameter. |
Examples of report parameters can include:
duration— Defines a minimum query execution-time threshold.limit— Defines the maximum number of rows to include in a report.timestart— Defines how many days to look back from the current time.
Parameter actions
The Actions column provides the following operations:
- Delete — Deletes the selected parameter.
- Edit — Opens the parameter definition for editing.
Warning
Verify that a parameter is no longer required by report configurations before deleting it.
Create a parameter
Select + New to open the New Parameter page.
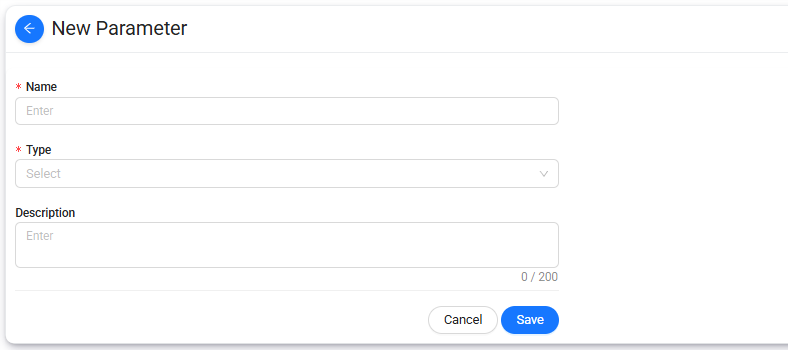
The following fields are available:
| Field | Description |
|---|---|
| Name | Specifies the parameter name. |
| Type | Specifies the data type of the parameter. |
| Description | Provides additional information about the purpose of the parameter. The description can contain up to 200 characters. |
To create a parameter:
- Enter a Name.
- Select a Type.
- Enter a Description, if required.
- Select Save.
Select Cancel to return without creating the parameter.
Assignment
The Assignment tab displays report definitions and the data source types with which report parameter configurations can be associated.
Use this page to review report-to-data-source relationships used by Spectrum reporting.
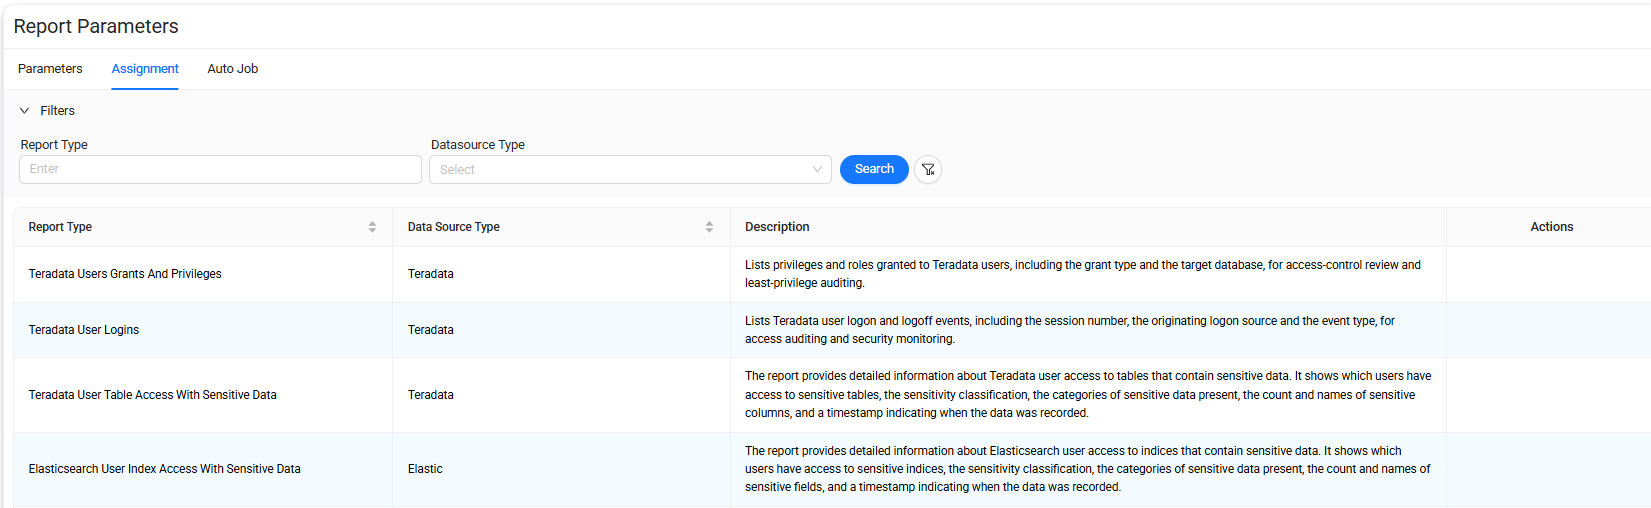
Assignment list
The list includes the following information:
| Column | Description |
|---|---|
| Report Type | Name of the Spectrum report type. |
| Data Source Type | Data source technology associated with the report. |
| Description | Description of the information provided by the report. |
| Actions | Actions available for the report parameter assignment, when applicable. |
Report definitions can be specific to particular data source technologies.
For example, the list can include reports for:
- User grants and privileges.
- User login and logoff activity.
- User access to sensitive tables.
- User access to sensitive indexes.
The description explains the purpose and scope of each report definition.
Auto Job
The Auto Job tab displays scheduled background jobs used by the reporting module.

The list includes the following information:
| Column | Description |
|---|---|
| Report Name | Technical name of the scheduled reporting job. |
| Description | Describes the function performed by the job. |
| Last Generation Time | Date and time of the most recent job execution or generation. |
| Schedule Time | Recurring schedule configured for the job. |
| Status | Current status of the job. |
| Actions | Actions available for managing the job. |
Auto Job types
Configured reporting jobs can perform operations such as:
- Automatically inserting report data sources into the system.
- Sending pending report email notifications.
- Cleaning up historical report data.
Examples include:
AUTO_JOB_REPORT_DATA_SOURCE_INSERTREPORT_MAIL_SENDREPORT_DATA_CLEANUP
Schedule Time
The Schedule Time column shows when each job runs automatically.
Schedules can include recurring patterns such as:
- Every specified number of minutes.
- At a specific time each day.
For example:
Every 5 minutes, every hour, every day
Last Generation Time
The Last Generation Time column shows the most recent recorded execution time for the scheduled job.
Use this value together with Schedule Time and Status to verify that the job is operating according to its configured schedule.
Status
The Status column indicates whether the scheduled job is currently enabled.
An Active status indicates that the job is enabled for scheduled execution.
Edit an Auto Job
Select Edit in the Actions column to modify the configuration of the selected reporting job.
Update the available settings as required, and then save the configuration.
System Parameters
The System Parameters page under Settings is used to review and manage configurable parameters that control system-wide behavior in Data Touch.
Parameters are grouped by functional area to make related settings easier to find and manage.
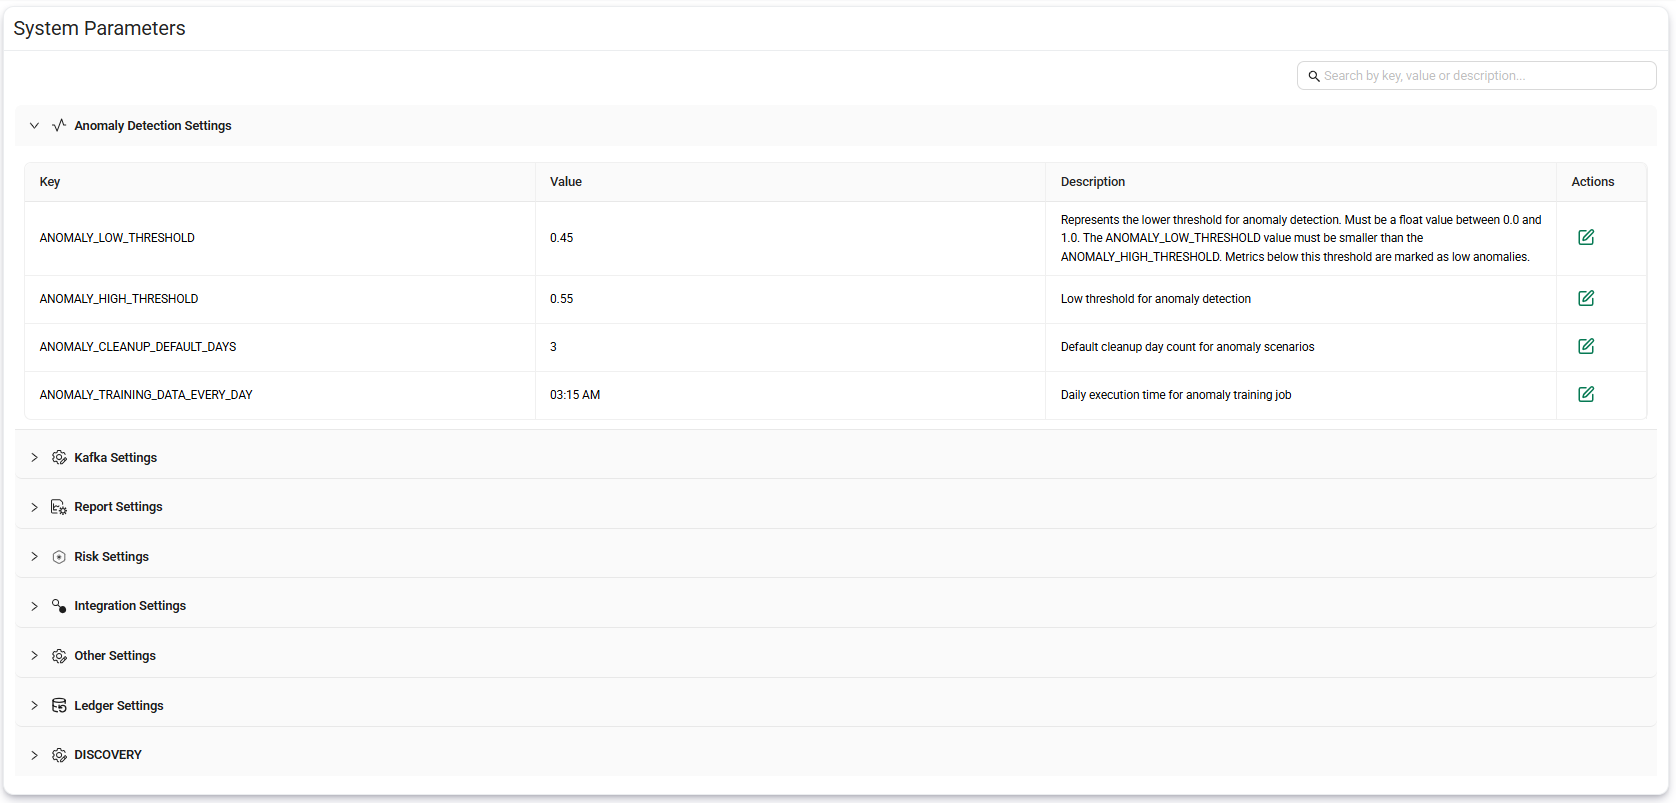
The page can include configuration groups such as:
- Anomaly Detection Settings
- Kafka Settings
- Report Settings
- Risk Settings
- Integration Settings
- Other Settings
- Ledger Settings
- DISCOVERY
Search parameters
Use the search field in the upper-right corner to find configuration entries by:
- Key
- Value
- Description
The search helps locate a specific system parameter without manually expanding each configuration group.
View parameter groups
Select a configuration group to expand or collapse its parameters.
Each parameter entry includes:
| Column | Description |
|---|---|
| Key | Technical identifier of the system parameter. |
| Value | Current value assigned to the parameter. |
| Description | Explains the purpose or expected behavior of the parameter. |
| Actions | Provides actions for managing the parameter. |
Edit a system parameter
Select Edit in the Actions column to modify the value of a system parameter.
Review the parameter description before changing its value to understand how the configuration affects Data Touch behavior.
Warning
System parameters can affect application-wide functionality, scheduled processes, integrations, risk calculations, anomaly detection, reporting, or other platform components. Modify these values only when the expected impact is understood.
Configuration groups
Each group contains parameters related to a specific Data Touch component or service.
For example:
- Anomaly Detection Settings contains parameters related to anomaly detection, training, thresholds, and retention behavior.
- Kafka Settings contains parameters related to Kafka-based data processing.
- Report Settings contains reporting-related system parameters.
- Risk Settings contains parameters used by the risk assessment components.
- Integration Settings contains integration-related configuration.
- Ledger Settings contains parameters related to ledger processing.
- DISCOVERY contains configuration used by Discovery-related processes.
Note
The available configuration groups and parameters can vary depending on the Data Touch version and enabled components.
UCMDB - Settings
The UCMDB - Settings page under Settings is used to configure connections to UCMDB environments and review the database assets discovered through those connections.

UCMDB Config
The UCMDB Config page displays the configured UCMDB connections.
UCMDB configuration list
The list includes the following information:
| Column | Description |
|---|---|
| id | Internal identifier of the UCMDB configuration. |
| Name | Name of the UCMDB connection. |
| Base API URL | Base API endpoint used to communicate with UCMDB. |
| User Name | User name configured for the UCMDB connection. |
| Repository | Repository associated with the connection. |
| Customer Name | Customer or client context associated with the UCMDB configuration. |
| Actions | Actions available for managing the configuration and reviewing discovery results. |
UCMDB actions
The Actions column provides the following operations:
- Delete
- Edit
- UCMDB Discovery Results
Delete a UCMDB configuration
Select Delete to remove the selected UCMDB configuration.
Warning
Verify that the UCMDB connection is no longer required before deleting it.
Edit a UCMDB configuration
Select Edit to open the existing UCMDB definition.
Modify the required connection settings, test the connection if necessary, and then save the configuration.
View UCMDB Discovery Results
Select UCMDB Discovery Results in the Actions column to view the database assets retrieved through the selected UCMDB configuration.
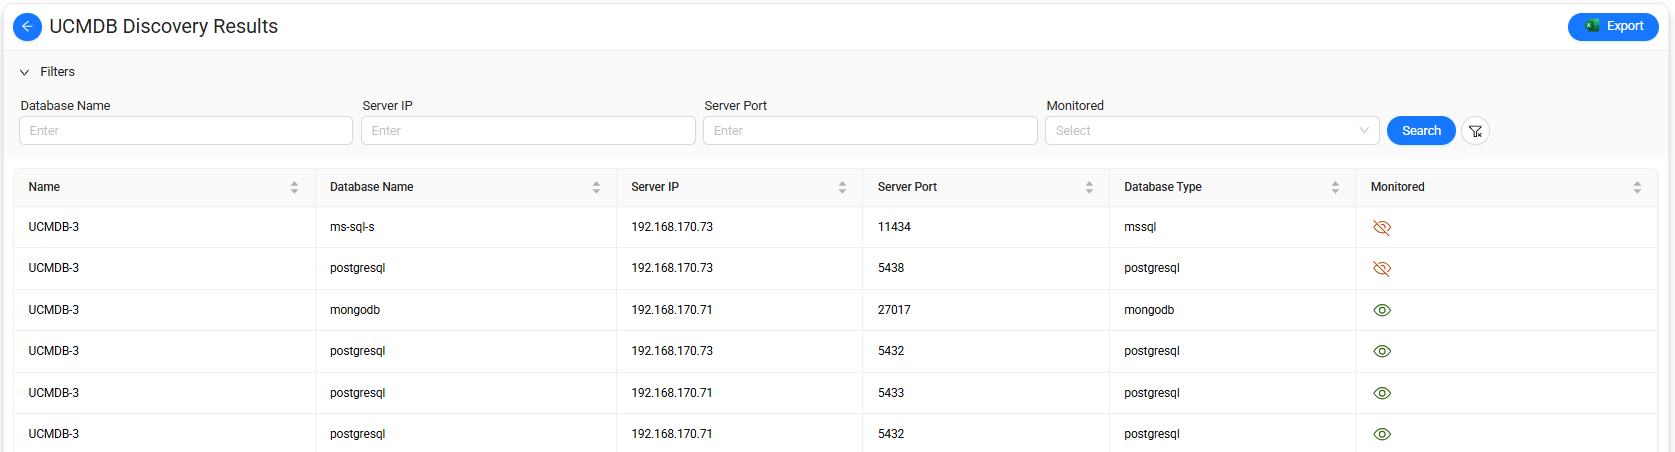
The page shows discovered database instances together with their connection and monitoring information.
Discovery Results list
The list includes:
| Column | Description |
|---|---|
| Name | Name of the UCMDB configuration that provided the record. |
| Database Name | Name of the discovered database. |
| Server IP | IP address of the database server. |
| Server Port | Port used by the database server. |
| Database Type | Type of the discovered database. |
| Monitored | Indicates whether the database is currently monitored by the DAM Agent. |
The Monitored column helps distinguish between database instances that are already covered by DAM monitoring and instances that may require further review.
Export discovery results
Select Export to export the displayed UCMDB Discovery Results to an Excel file.
If filters are applied, the export contains the filtered results.
Create a UCMDB configuration
Select + New on the UCMDB Config page to open the UCMDB Definition page.
Use this page to configure the API connection and context required to retrieve information from UCMDB.
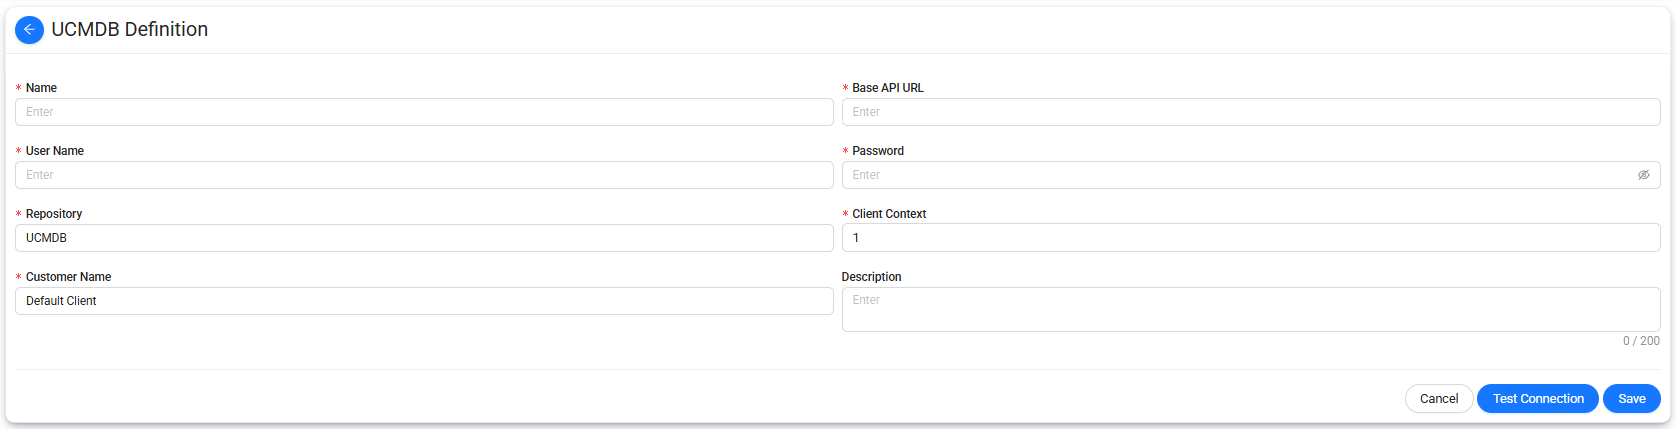
The following fields are available:
| Field | Description |
|---|---|
| Name | Specifies the name of the UCMDB configuration. |
| Base API URL | Specifies the base REST API endpoint of the UCMDB environment. |
| User Name | Specifies the user name used to authenticate with UCMDB. |
| Password | Specifies the password used for authentication. |
| Repository | Specifies the UCMDB repository. |
| Client Context | Specifies the client context used for the UCMDB connection. |
| Customer Name | Specifies the customer or client name associated with the connection. |
| Description | Provides additional information about the configuration. The description can contain up to 200 characters. |
Test the connection
After entering the required connection settings, select Test Connection to verify that Data Touch can communicate with the configured UCMDB environment.
Resolve any connection issues before saving the definition.
Save the UCMDB configuration
To create a UCMDB configuration:
- Enter a Name.
- Enter the Base API URL.
- Enter the User Name and Password.
- Configure the Repository.
- Enter the Client Context.
- Enter the Customer Name.
- Enter a Description, if required.
- Select Test Connection.
- Select Save.
Data Touch creates the configuration and adds it to the UCMDB Config list.
Select Cancel to return without saving the configuration.
Source Settings
The Source Settings page under Settings is used to manage which discovered catalog sources are enabled for Data Touch processing and to access their sensitive data settings.
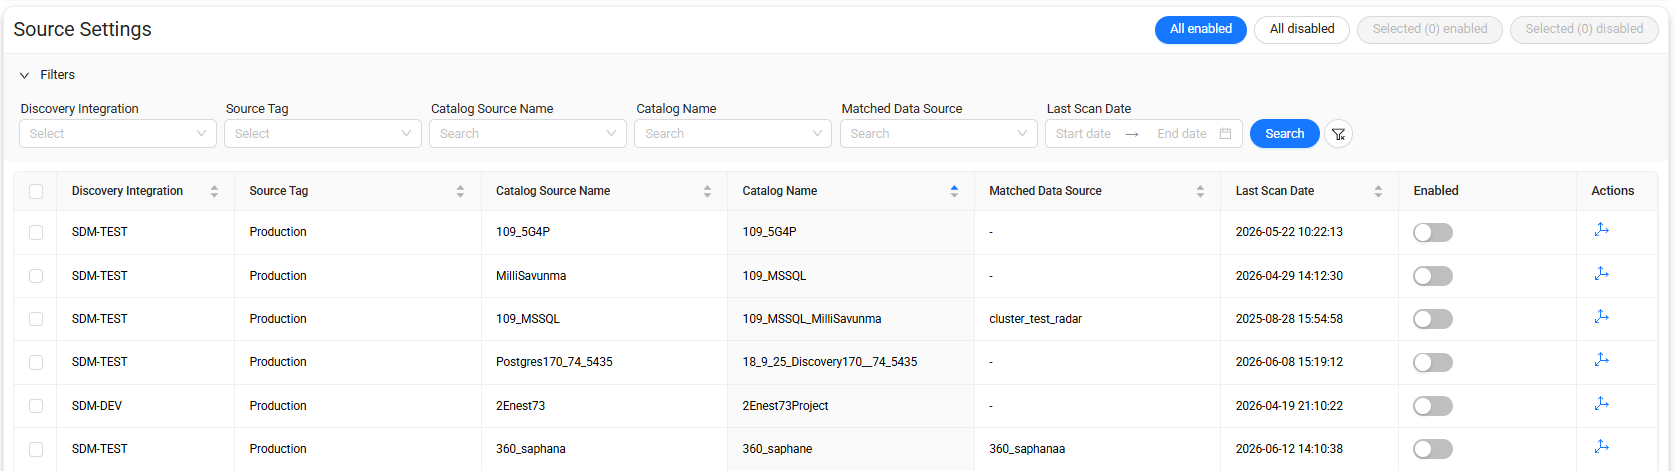
Source list
The list includes the following information:
| Column | Description |
|---|---|
| Discovery Integration | Discovery integration through which the source was identified. |
| Source Tag | Source tag associated with the discovered source. |
| Catalog Source Name | Name of the source received from the Discovery integration. |
| Catalog Name | Catalog associated with the source. |
| Matched Data Source | Data Touch data source matched with the discovered catalog source, if available. |
| Last Scan Date | Date and time of the most recent scan. |
| Enabled | Indicates whether the source is enabled. |
| Actions | Provides access to sensitive settings for the source. |
Enable or disable sources
Use the Enabled toggle to enable or disable an individual source.
The following bulk actions are also available:
- All enabled — Enables all displayed sources.
- All disabled — Disables all displayed sources.
- Selected enabled — Enables the selected sources.
- Selected disabled — Disables the selected sources.
To enable or disable specific records:
- Select the corresponding checkboxes.
- Select Selected enabled or Selected disabled.
Open Sensitive Settings
Select Sensitive Settings in the Actions column to open the sensitive data settings associated with the selected source.
The Sensitive Settings page displays the sensitive types identified for the corresponding catalog and allows you to manage whether they are enabled.
Sensitive Settings
The Sensitive Settings page under Settings is used to review and manage sensitive data types identified in discovered catalogs.
Use this page to control whether individual sensitive types are enabled and to view the related schema, table, and column details.
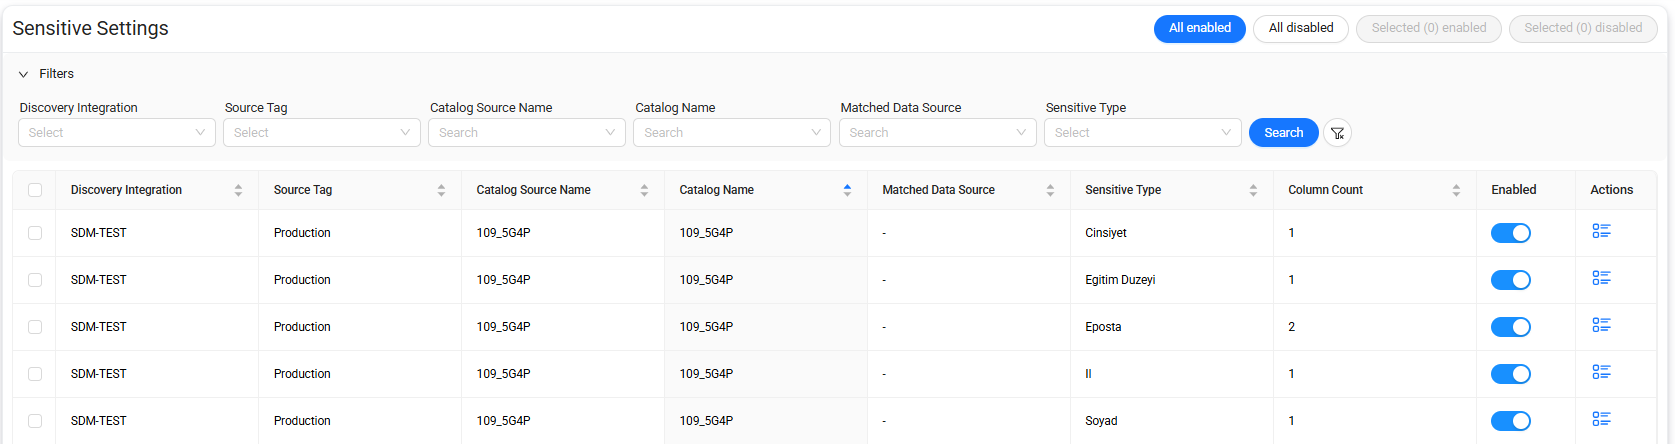
Sensitive type list
The list includes the following information:
| Column | Description |
|---|---|
| Discovery Integration | Discovery integration through which the catalog was identified. |
| Source Tag | Source tag associated with the catalog source. |
| Catalog Source Name | Name of the source received from the Discovery integration. |
| Catalog Name | Name of the catalog that contains the sensitive data. |
| Matched Data Source | Data Touch data source matched with the catalog, if available. |
| Sensitive Type | Sensitive data classification identified in the catalog. |
| Column Count | Number of columns associated with the sensitive type. |
| Enabled | Indicates whether the sensitive type is enabled. |
| Actions | Provides access to detailed sensitive catalog information. |
Enable or disable sensitive types
Use the Enabled toggle to enable or disable an individual sensitive type.
The following bulk actions are also available:
- All enabled — Enables all sensitive types in the list.
- All disabled — Disables all sensitive types in the list.
- Selected enabled — Enables the selected sensitive types.
- Selected disabled — Disables the selected sensitive types.
To change the state of specific records:
- Select the corresponding checkboxes.
- Select Selected enabled or Selected disabled.
View sensitive catalog details
Select Details in the Actions column to open the Sensitive Catalog Detail page for the selected sensitive type.
Sensitive Catalog Detail
The Sensitive Catalog Detail page provides column-level information for the selected sensitive type.
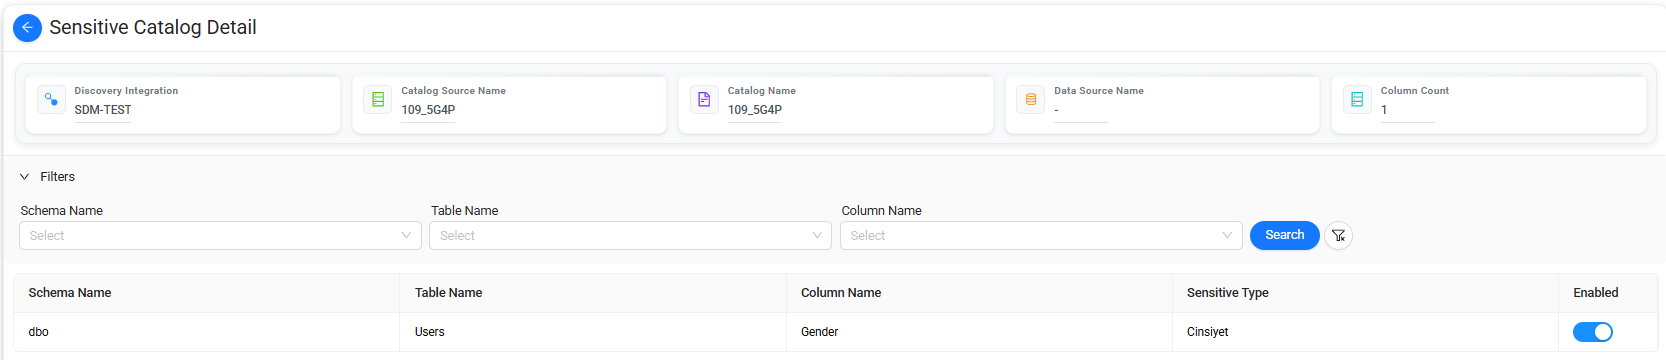
Summary cards at the top of the page display the following information:
| Item | Description |
|---|---|
| Discovery Integration | Discovery integration associated with the selected catalog. |
| Catalog Source Name | Name of the catalog source. |
| Catalog Name | Name of the selected catalog. |
| Data Source Name | Data Touch data source matched with the catalog, if available. |
| Column Count | Number of columns associated with the selected sensitive type. |
Sensitive column list
The list includes the following information:
| Column | Description |
|---|---|
| Schema Name | Schema that contains the sensitive column. |
| Table Name | Table that contains the sensitive column. |
| Column Name | Name of the sensitive column. |
| Sensitive Type | Sensitive data classification assigned to the column. |
| Enabled | Indicates whether the sensitive column is enabled. |
Enable or disable a sensitive column
Use the Enabled toggle to enable or disable an individual sensitive column.
This setting provides more granular control by allowing sensitive data configuration at the column level.
Health Check
The Health Check page under Settings is used to monitor the operational status of Data Touch services and their dependent components.
The page provides a centralized view of service health and helps identify components that may require investigation.
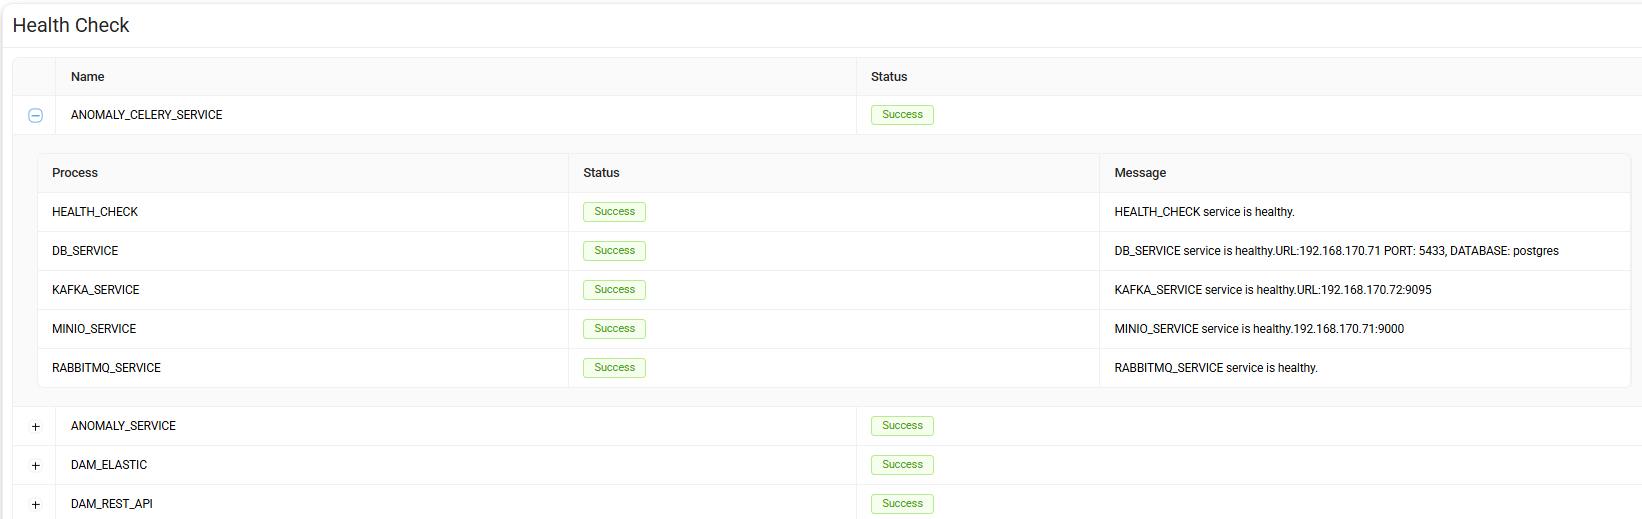
Service list
The main list includes the following information:
| Column | Description |
|---|---|
| Name | Name of the Data Touch service or component. |
| Status | Current health status of the service. |
A Success status indicates that the corresponding service is operating normally.
View service details
Select the expand icon next to a service to view its detailed health checks.
The expanded section includes:
| Column | Description |
|---|---|
| Process | Name of the component or dependency checked for the selected service. |
| Status | Health status of the individual check. |
| Message | Additional information returned by the health check. |
The detailed view can include checks for internal services, database connectivity, messaging components, storage services, or other dependencies required by the selected Data Touch service.
Review health status
Use the Status and Message information together when reviewing a service.
- Success indicates that the health check completed successfully.
- A non-successful status indicates that the related service or dependency may require further investigation.
- The Message field provides additional diagnostic information about the check result.
Note
The components displayed under each service depend on the service architecture and its configured dependencies.
Octo Integration
The Octo Integration page under Settings provides the API connection details and a test interface for retrieving Data Touch environment information through the Octo integration endpoint.
Use this page to:
- Review the API endpoint and authentication requirements.
- Review the supported request fields.
- Test authenticated API requests.
- Filter environment records.
- Review the returned results.
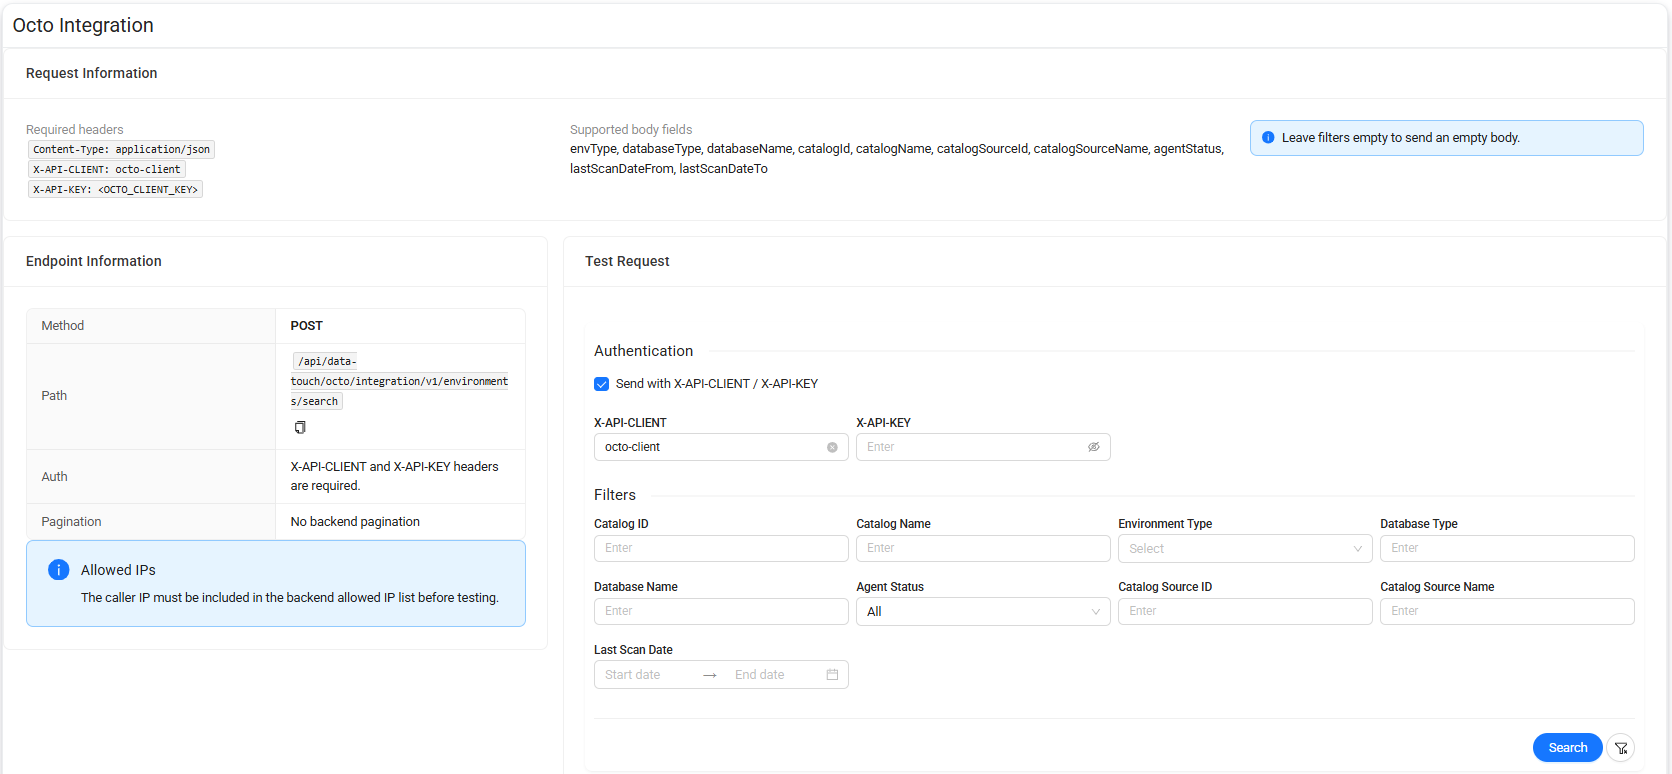

Request Information
The Request Information section summarizes the headers and request-body fields supported by the Octo integration API.
Required headers
The request requires the following headers:
Content-Type: application/json
X-API-CLIENT: octo-client
X-API-KEY: <OCTO_CLIENT_KEY>
The X-API-CLIENT and X-API-KEY headers are used to authenticate requests to the endpoint.
Supported body fields
The request body can contain filtering fields such as:
envTypedatabaseTypedatabaseNamecatalogIdcatalogNamecatalogSourceIdcatalogSourceNameagentStatuslastScanDateFromlastScanDateTo
Note
Leave the filters empty to send an empty request body.
Endpoint Information
The Endpoint Information section provides the technical information required to call the Octo integration API.
| Item | Description |
|---|---|
| Method | HTTP method used by the endpoint. |
| Path | API path used to retrieve environment information. |
| Auth | Authentication headers required by the endpoint. |
| Pagination | Indicates whether backend pagination is supported. |
The endpoint uses the POST method.
The API path is:
/api/data-touch/octo/integration/v1/environments/search
Authentication requires both:
X-API-CLIENTX-API-KEY
Backend pagination is not used for this endpoint.
Important
The caller IP address must be included in the backend allowed-IP list before the endpoint can be tested successfully.
Test Request
The Test Request section allows you to send a request directly from Data Touch and review the returned environment information.
Authentication
Enable Send with X-API-CLIENT / X-API-KEY to include the required authentication headers in the test request.
Enter:
- X-API-CLIENT
- X-API-KEY
Warning
Treat the API key as a credential and do not expose it in documentation, screenshots, or shared environments.
Results
The Results section displays the environment records returned by the API request.
The list can include the following information:
| Column | Description |
|---|---|
| ID | Identifier of the returned environment record. |
| Environment Type | Type of the environment. |
| Database Type | Type of the database. |
| Database Name | Name of the database. |
| Server IP | IP address of the database server. |
| Server Port | Port used by the database server. |
| Agent Status | Current agent or monitoring status associated with the database. |
| Catalog ID | Identifier of the catalog. |
| Catalog Name | Name of the catalog. |
| Catalog Source ID | Identifier of the catalog source. |
| Catalog Source Name | Name of the catalog source. |
| Last Scan Date | Date and time of the most recent scan. |
| Sensitive Type Count | Number of sensitive types identified for the record. |
| Sensitive Column Count | Number of columns identified as sensitive. |
| Column Count | Total number of columns associated with the record. |
If no test request has been sent, the results area remains empty.
Use the returned information to verify that the endpoint, authentication settings, filters, and Octo integration are working as expected.