Dashboard
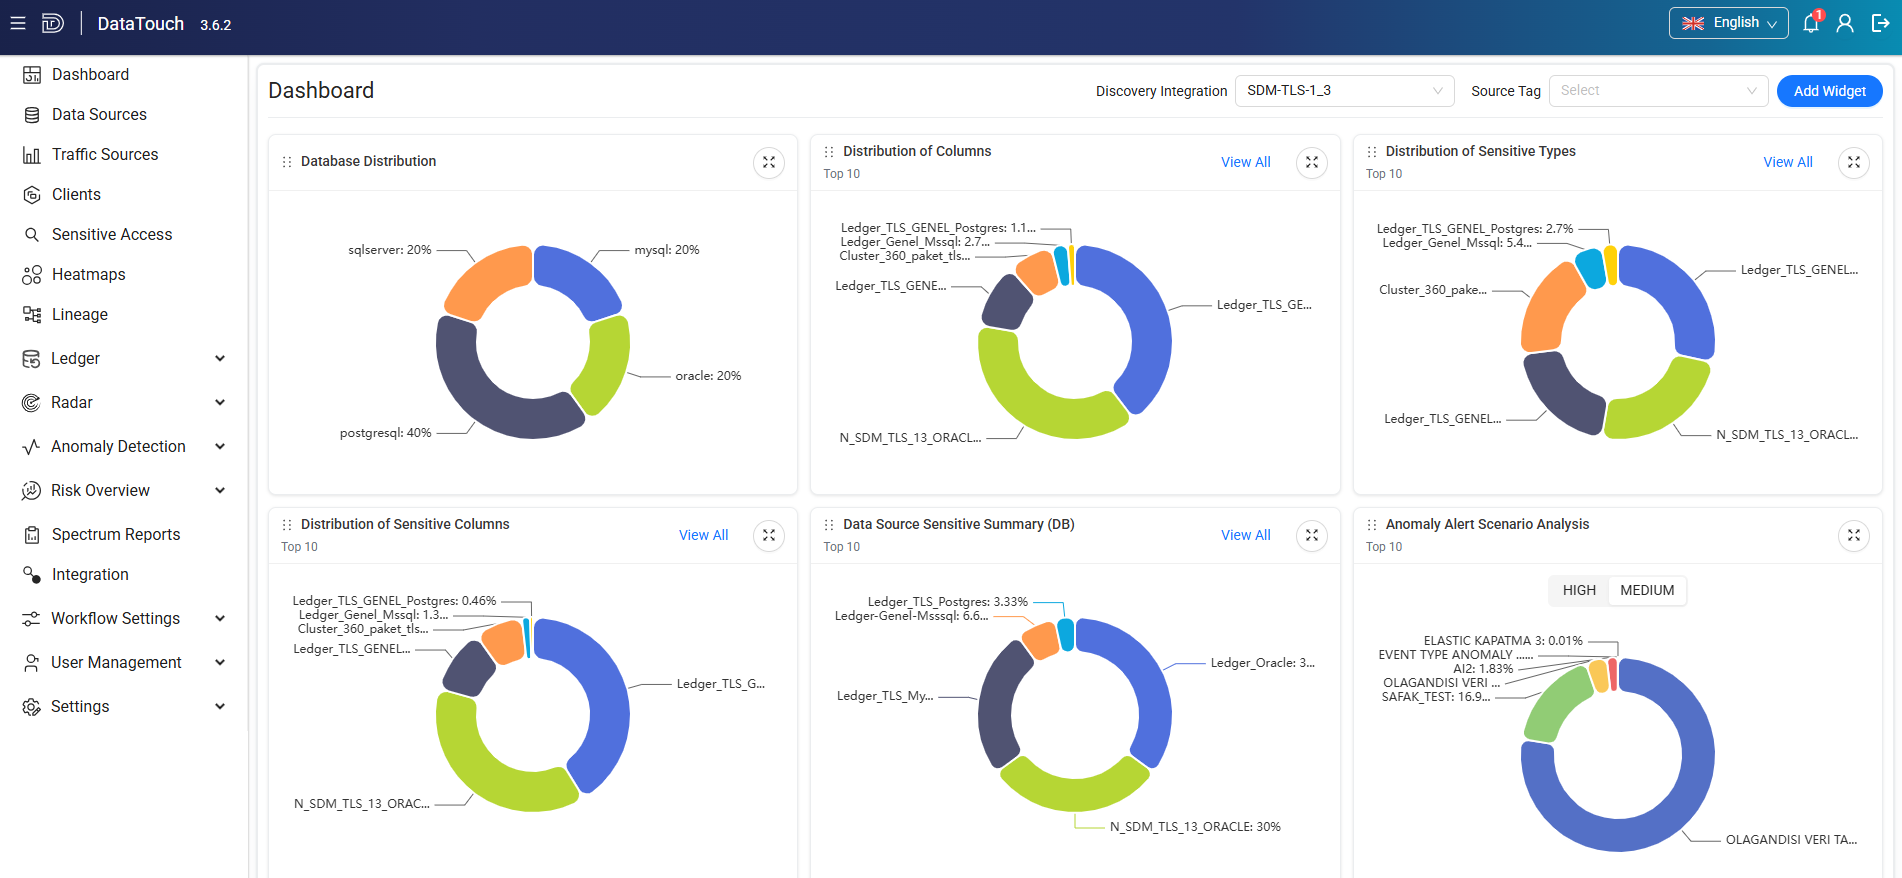
When you sign in to Data Touch, the Main Dashboard opens by default. The dashboard displays information about the data sources available in your environment based on your user role.
The Main Dashboard provides an overview of:
- Data sources
- Columns
- Sensitive data
- Sensitive types
- Anomaly alerts
- Risk assessments
- Discovery integrations
- Spectrum reports
You can filter the dashboard by:
- Discovery Integration
- Source Tag
Select a value from the corresponding drop-down list to update the dashboard data.
Tip
You can customize the Main Dashboard by adding or removing widgets. Select Add Widget in the upper-right corner to manage the widgets displayed on the dashboard.
Charts
The Main Dashboard includes the following charts and widgets:
- Database Distribution
- Distribution of Columns
- Distribution of Sensitive Types
- Distribution of Sensitive Columns
- Data Source Sensitive Summary (DB)
- Anomaly Alert Scenario Analysis
- Anomaly Alert Severity Distribution
- Anomaly Alert Total Counts
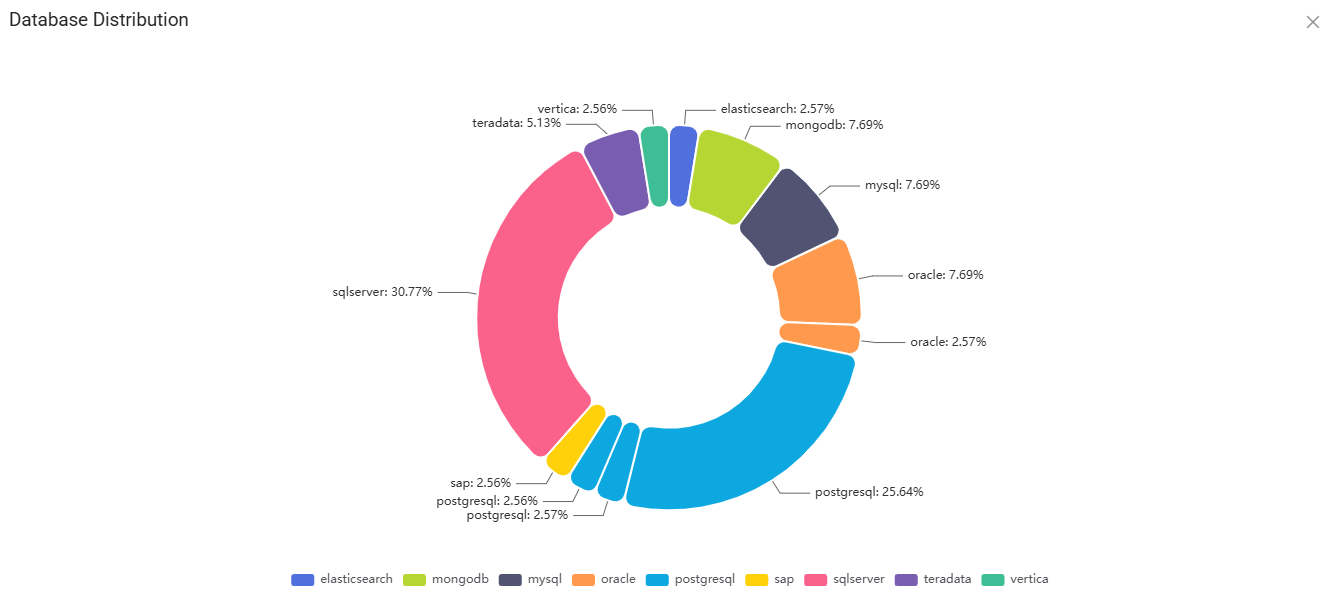
Database Distribution
The Database Distribution chart shows the distribution of data sources by database type.
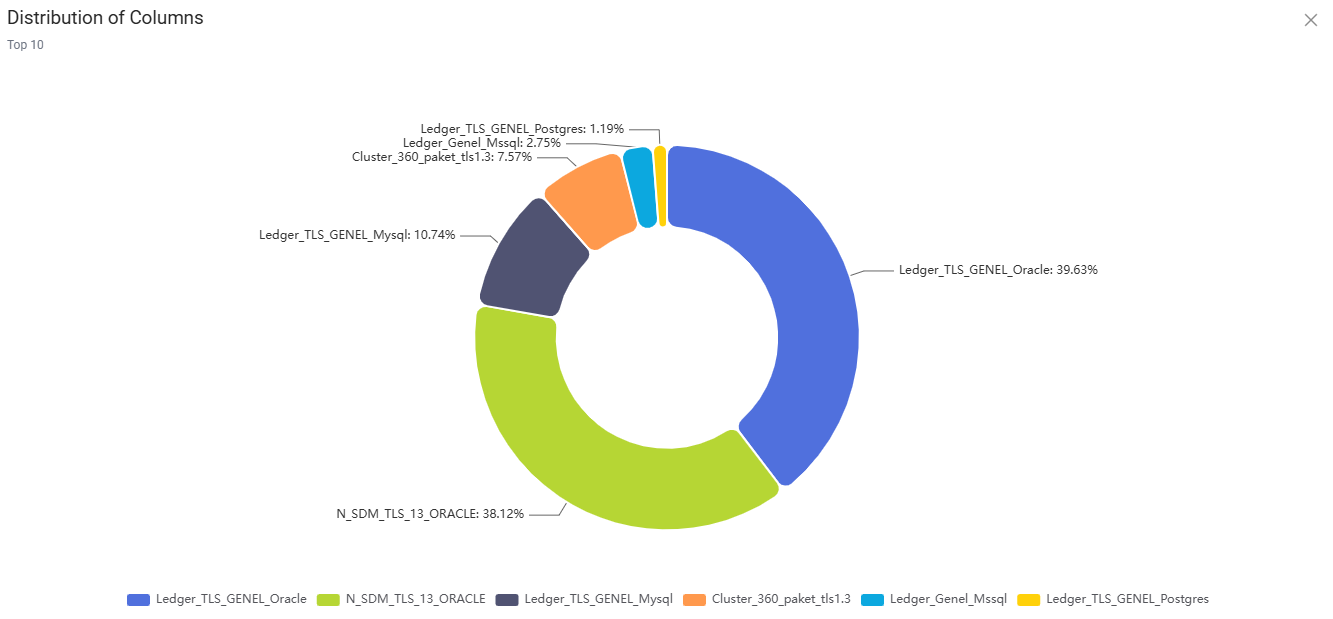
Distribution of Columns
The Distribution of Columns chart shows the total number and distribution of columns across data sources discovered through the Discovery process.
The chart displays the top 10 data sources by default. Select View All to view all data sources.
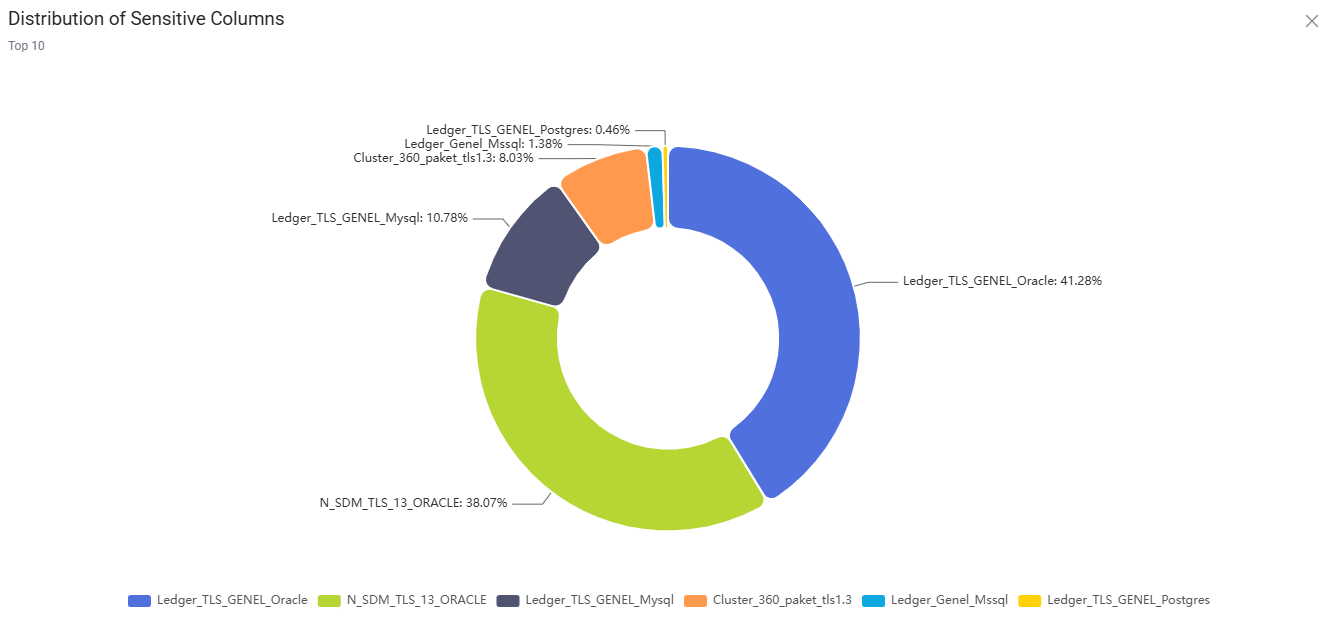
Distribution of Sensitive Columns
The Distribution of Sensitive Columns chart shows the total number and distribution of columns that contain sensitive data.
The chart displays the top 10 data sources by default. Select View All to view all data sources.
Distribution of Sensitive Types
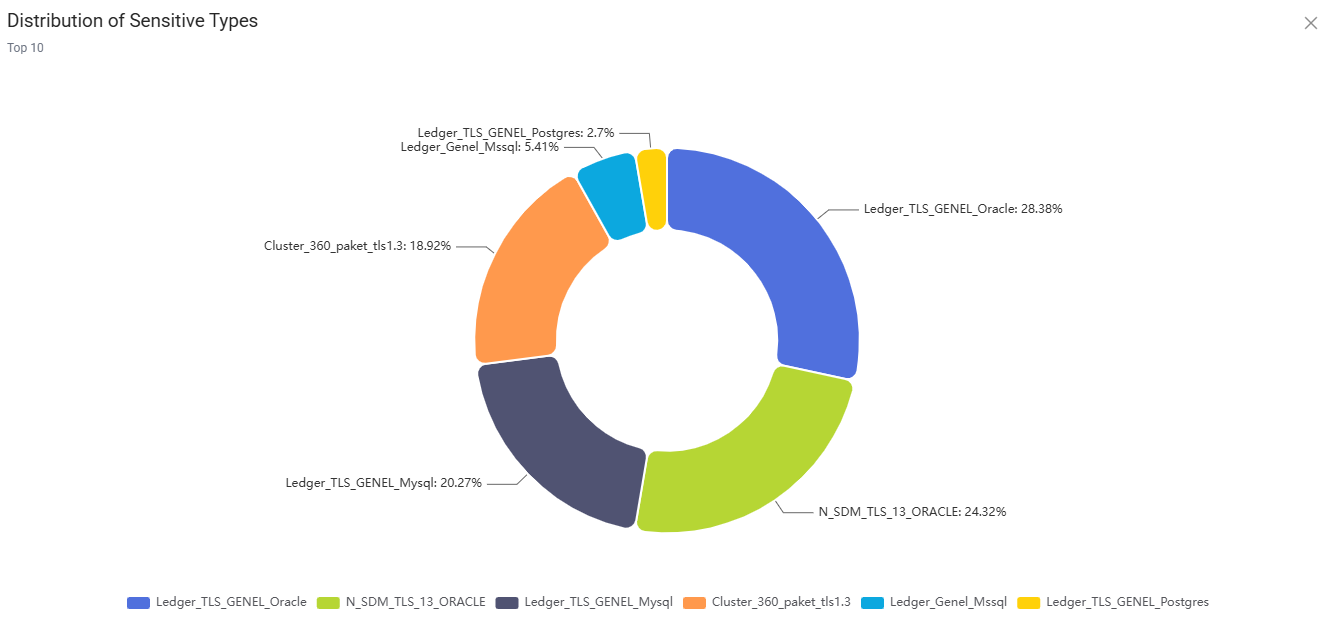
The Distribution of Sensitive Types chart shows the distribution of sensitive data types identified across discovered data sources.
Sensitive types can include predefined categories such as:
- Date of birth
- Credit card information
- Other configured sensitive data categories
The chart displays the top 10 sensitive types by default. Select View All to view all sensitive types.
Data Source Sensitive Summary (DB)
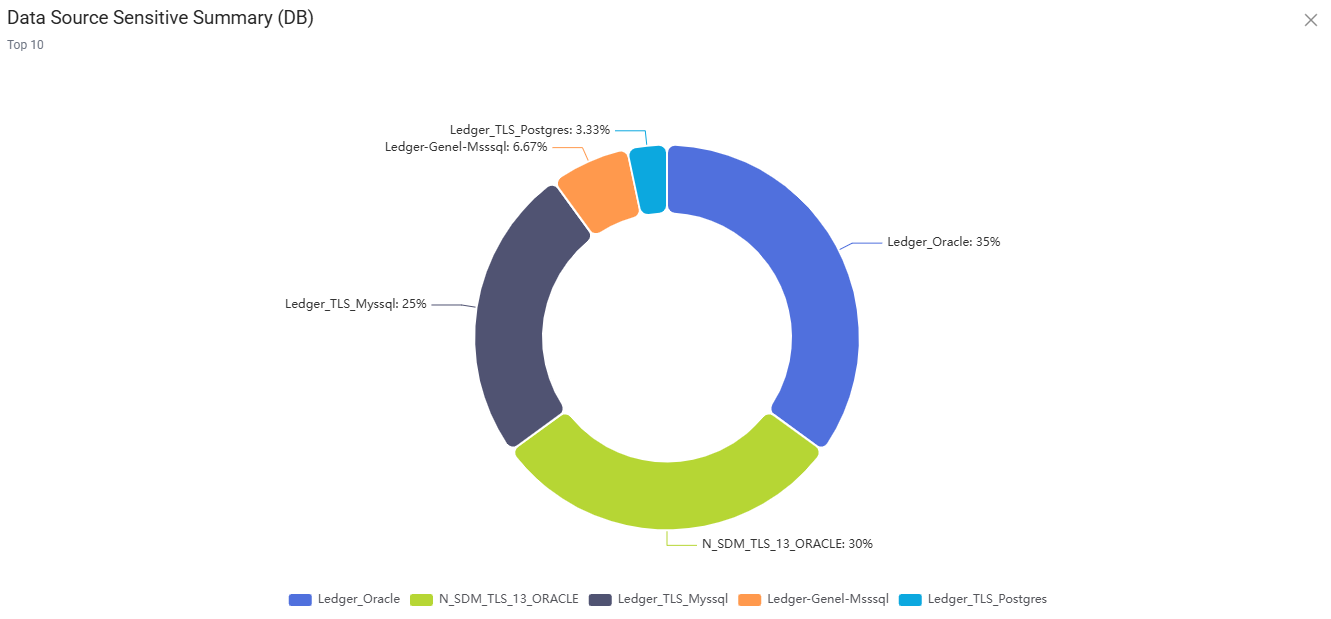
The Data Source Sensitive Summary (DB) chart shows the distribution of sensitive data identified in each data source.
The chart displays the top 10 data sources by default. Select View All to view all data sources.
Filter chart data
Some charts allow you to include or exclude individual data sources from the displayed results.
To filter a pie or doughnut chart:
- Expand the chart, if necessary.
- Select a data source name to exclude it from the chart.
- Select the data source name again to include it.
Note
Hover over a chart segment to view its exact value and percentage.
Anomaly Alerts
The Main Dashboard includes widgets for monitoring anomaly alerts and their distribution.
Anomaly Alert Scenario Analysis
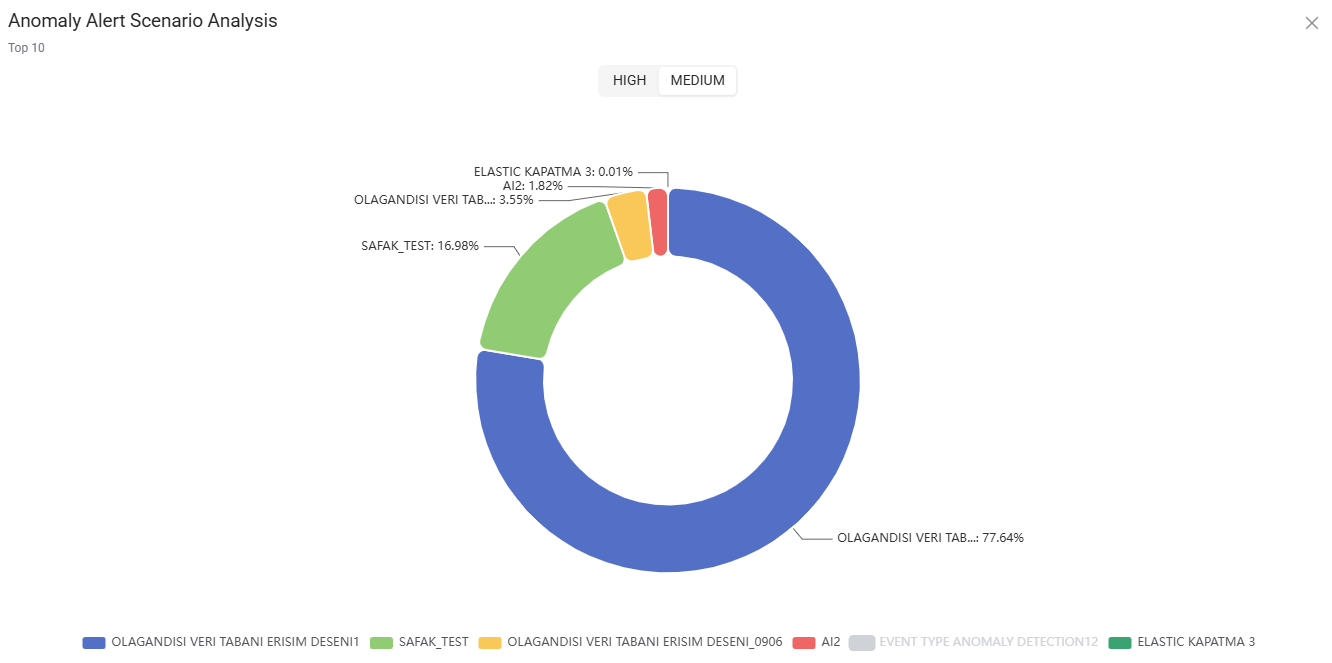
The Anomaly Alert Scenario Analysis chart shows the distribution of anomaly alerts by detection scenario.
Use the HIGH and MEDIUM tabs to filter the displayed alerts by severity.
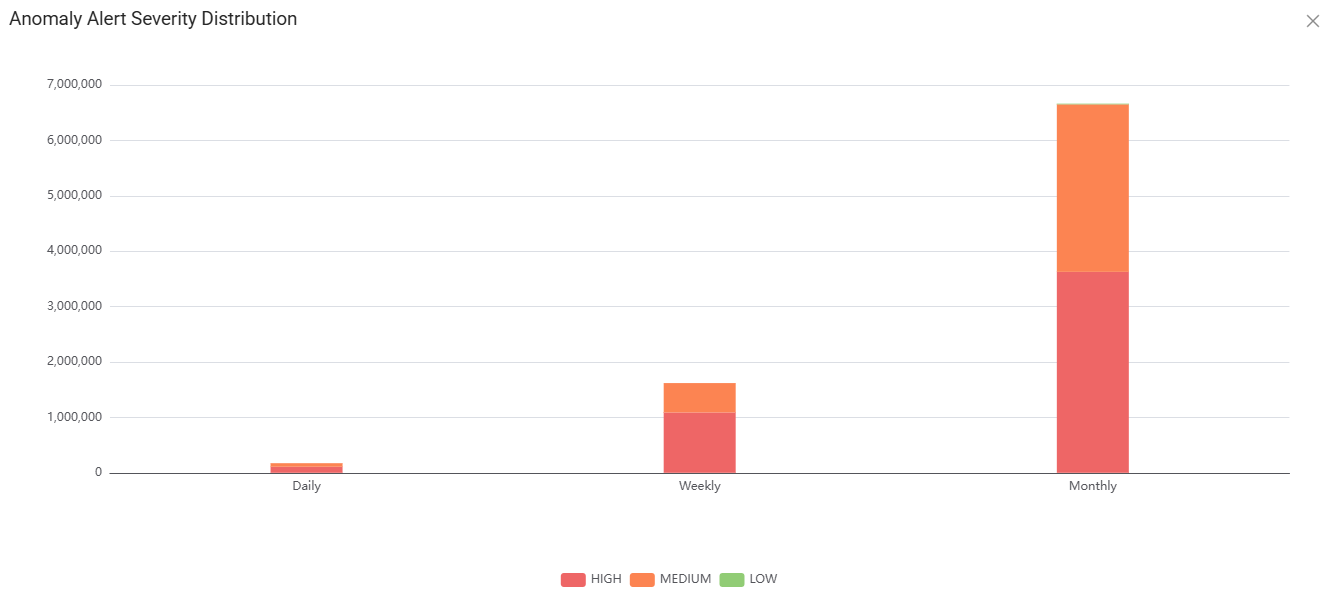
Anomaly Alert Severity Distribution
The Anomaly Alert Severity Distribution chart shows anomaly alerts by severity and reporting period.
Alerts are grouped into the following severity levels:
- High
- Medium
- Low
You can review alert counts for the following periods:
- Daily
- Weekly
- Monthly
Anomaly Alert Total Counts
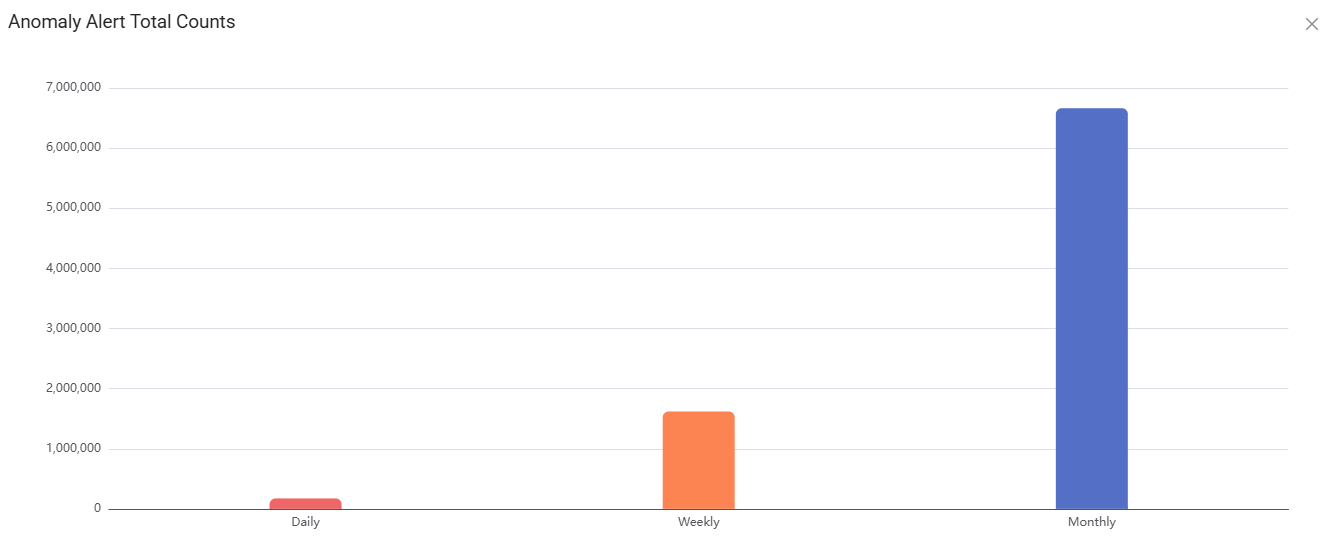
The Anomaly Alert Total Counts chart shows the total number of anomaly alerts for the following periods:
- Daily
- Weekly
- Monthly
Use this chart to compare overall alert volumes across reporting periods.
Data Sources
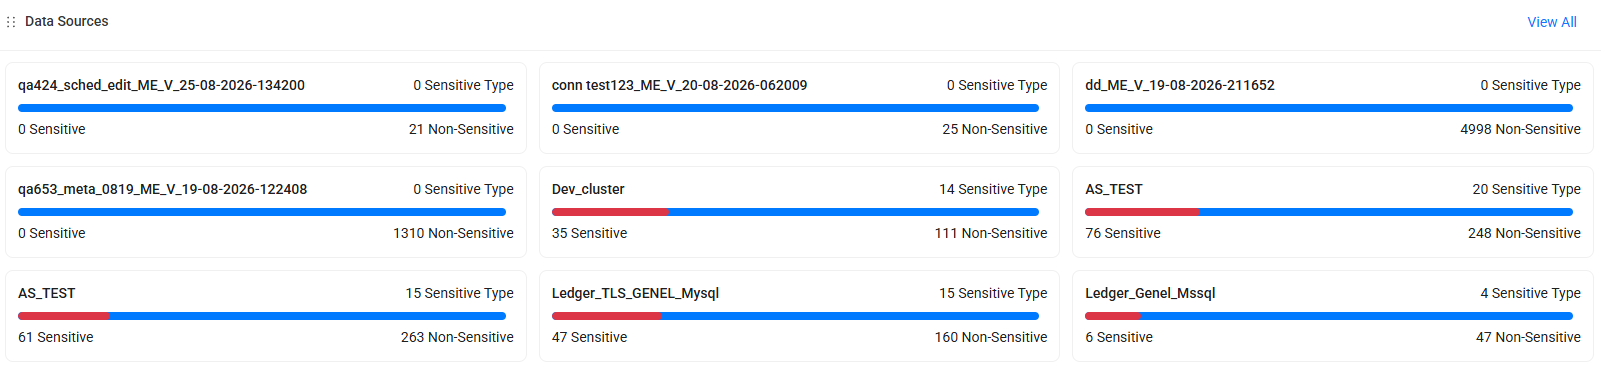
The Data Sources widget displays recently discovered or scanned data sources.
For each data source, the widget displays:
- The number of Sensitive columns
- The number of Non-Sensitive columns
- The number of identified Sensitive Types
- A visual representation of the distribution of sensitive and non-sensitive columns
Select View All to view all data sources.
Note
The information displayed in the Data Sources widget depends on the selected dashboard filters and the user's role.
Risk Assessments
The Database Risk Assessment and User Risk Assessment charts show the number of identified risks by severity:
- High
- Medium
- Low
Select a risk category to open the corresponding risk details. Select View All to open the related risk menu.

Discovery Integration Summary
The Discovery Integration Summary widget provides an overview of assets, catalogs, and users identified through Discovery integrations.
The widget includes values for the following categories:
- Data Sources
- Matching Data Sources
- Catalog Sources
- Catalogs
- Machine Names
- Traffic Data Sources
- Database Users
- Operating System Users

Last Spectrum Reports
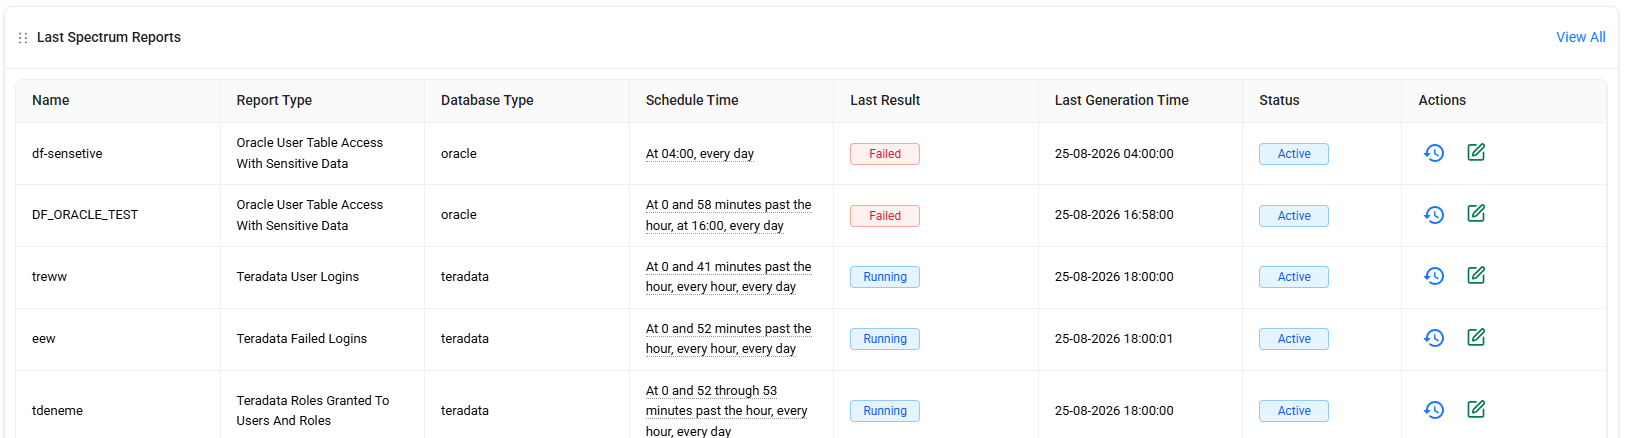
The Last Spectrum Reports widget displays the most recent Spectrum reports and their details.
Use the Actions column to:
- View a report's history.
- Edit a report.
Select View All to open the Spectrum Reports page.