Sensitive Access
The Sensitive Access menu provides reporting capabilities for monitoring access to sensitive data across data sources.
The Sensitive Access Reports page displays existing reports and their generation status.
You can use this page to:
- Search for and filter existing reports.
- Create a Sensitive Access report.
- Clone an existing report.
- View report details.
- Download a generated report.
- Delete a report.
- Refresh the report list.
- Export the report list to Excel.
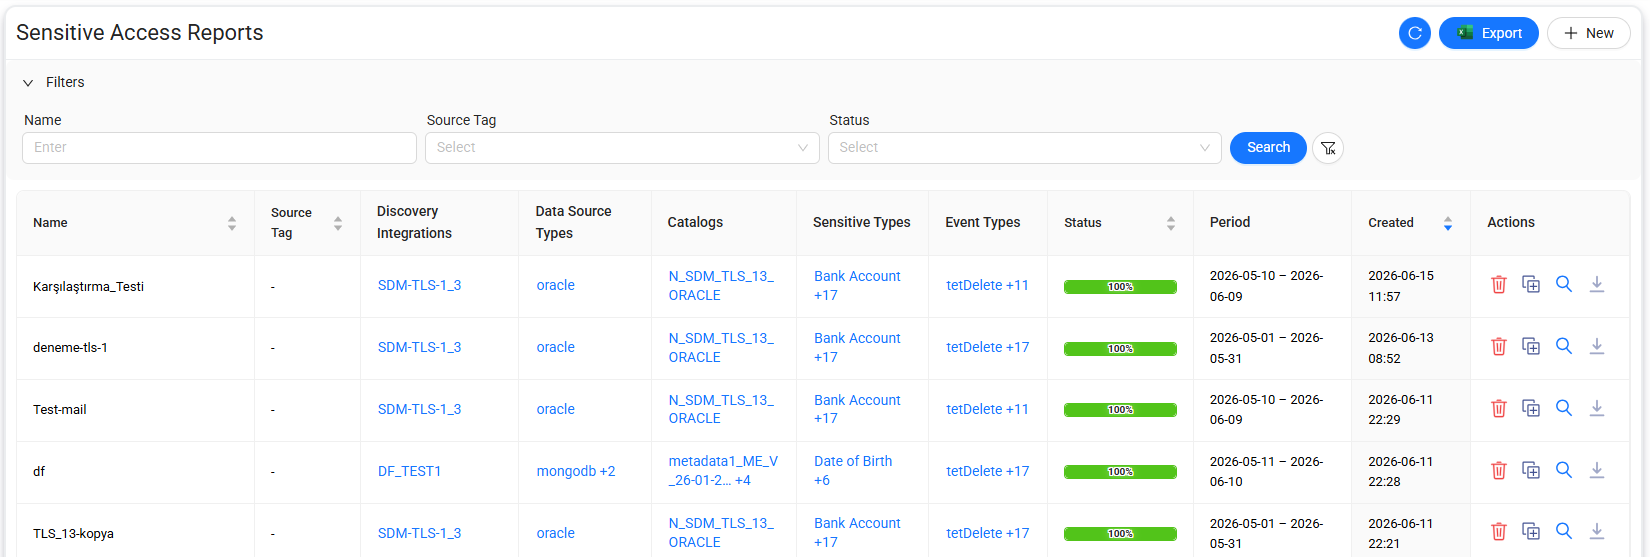
Filter reports
Expand Filters to narrow the report list.
The following filters are available:
| Filter | Description |
|---|---|
| Name | Filters reports by report name. |
| Source Tag | Filters reports by the source tag associated with the report. |
| Status | Filters reports by report generation status. |
To filter the report list:
- Enter or select the required filter criteria.
- Select Search.
Use the clear-filter button next to Search to reset the selected filters.
Report list
The report list includes the following information:
| Column | Description |
|---|---|
| Name | Name of the report. |
| Source Tag | Source tag associated with the report. |
| Discovery Integrations | Discovery integrations included in the report. |
| Data Source Types | Data source types included in the report. |
| Catalogs | Catalogs included in the report. |
| Sensitive Types | Sensitive types included in the report. |
| Event Types | Event types included in the report. |
| Status | Current report generation progress. |
| Period | Date range covered by the report. |
| Created | Date and time when the report was created. |
| Actions | Actions available for the report. |
Note
When a field contains multiple values, Data Touch may display the first value followed by a +N indicator. The indicator shows the number of additional values associated with the report.
Report status
The Status column shows report generation progress as a percentage.
A status of 100% indicates that report generation is complete.
Refresh the report list
Select the Refresh button in the upper-right corner to update the report list and retrieve the latest report generation status.
This option is useful when one or more reports are still being generated.
Export reports
Select Export to export the displayed report list to an Excel file.
If filters are applied, the export contains the filtered results.
Report actions
The Actions column provides the following actions for each report:
- Delete: Deletes the selected Sensitive Access report.
- Clone: Creates a new report definition based on the selected report.
- Sensitive Access Details: Opens the detailed results of the selected report.
- Download: Downloads the generated report.
Clone a report
Use Clone to create a new report based on an existing report configuration.
When you clone a report, Data Touch opens a new report definition populated with the configuration of the selected report.
To create a report from an existing configuration:
- Select Clone for the report you want to reuse.
- Modify the report definition as needed.
- Select Save.
Data Touch creates a new report without modifying the original report.
Note
The availability of some report actions may depend on the report generation status.
Create a Sensitive Access report
Select + New on the Sensitive Access Reports page to open the Sensitive Access Report Definition page.
Use this page to define the scope and reporting period of the report.
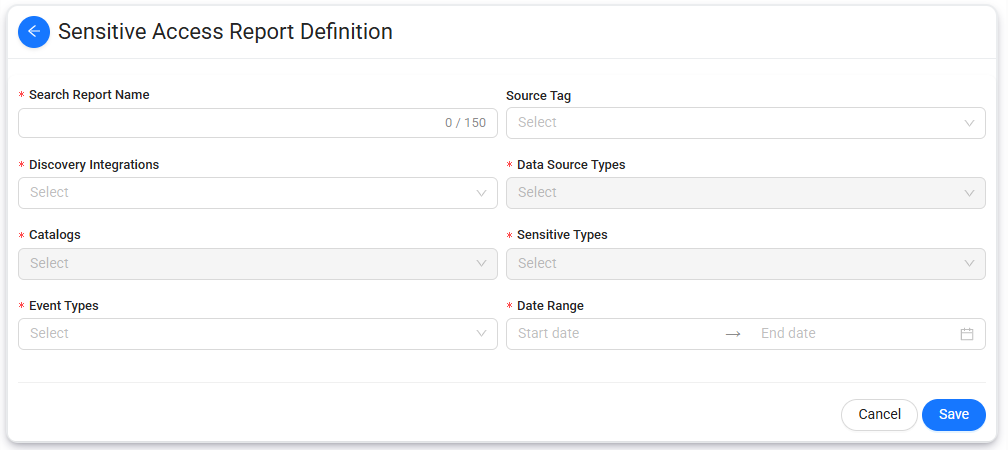
Report definition fields
The following fields are available:
| Field | Description |
|---|---|
| Search Report Name | Specifies the report name. The name can contain up to 150 characters. |
| Source Tag | Limits the report scope to data sources associated with the selected source tag. |
| Discovery Integrations | Specifies the Discovery integrations to include in the report. |
| Data Source Types | Specifies the data source types to include in the report. |
| Catalogs | Specifies the catalogs to include in the report. |
| Sensitive Types | Specifies the sensitive types to include in the report. |
| Event Types | Specifies the event types to include in the report. |
| Date Range | Defines the start and end dates of the reporting period. |
Create the report
To create a Sensitive Access report:
- Enter a report name in Search Report Name.
- Optionally, select a Source Tag.
- Select the required Discovery Integrations.
- Select the Data Source Types to include.
- Select the Catalogs to include.
- Select the Sensitive Types to include.
- Select the Event Types to include.
- In Date Range, select the start and end dates.
- Select Save.
Data Touch creates the report and adds it to the Sensitive Access Reports list.
The Status column shows the report generation progress.
Select Cancel to return to the previous page without saving the report.
Sensitive Access Details
Select Sensitive Access Details  from the Actions column of a report to open its detailed results.
The page title includes the name of the selected report.

The Sensitive Access Details page provides an aggregated view of sensitive-data access activity within the scope of the selected report.
Sensitive Access summary
The results table includes the following information:
| Column | Description |
|---|---|
| Discovery Integration | Discovery integration associated with the result. |
| Catalog | Catalog associated with the access activity. |
| Sensitive Count | Number of sensitive data findings associated with the catalog. |
| Unique Client Count | Number of unique clients that accessed data in the catalog. |
| Database User Count | Number of database users associated with the access activity. |
| Query Count | Total number of queries associated with the catalog. |
| Actions | Provides access to detailed catalog information. |
Export Sensitive Access details
Select Export in the upper-right corner to export the displayed results to an Excel file.
If filters are applied, the export contains the filtered results.
View Catalog Details
Select Catalog Details  in the Actions column to open detailed sensitive-access information for the selected catalog.
Catalog Details
The Catalog Details page provides a detailed breakdown of sensitive-data access activity for the selected catalog.
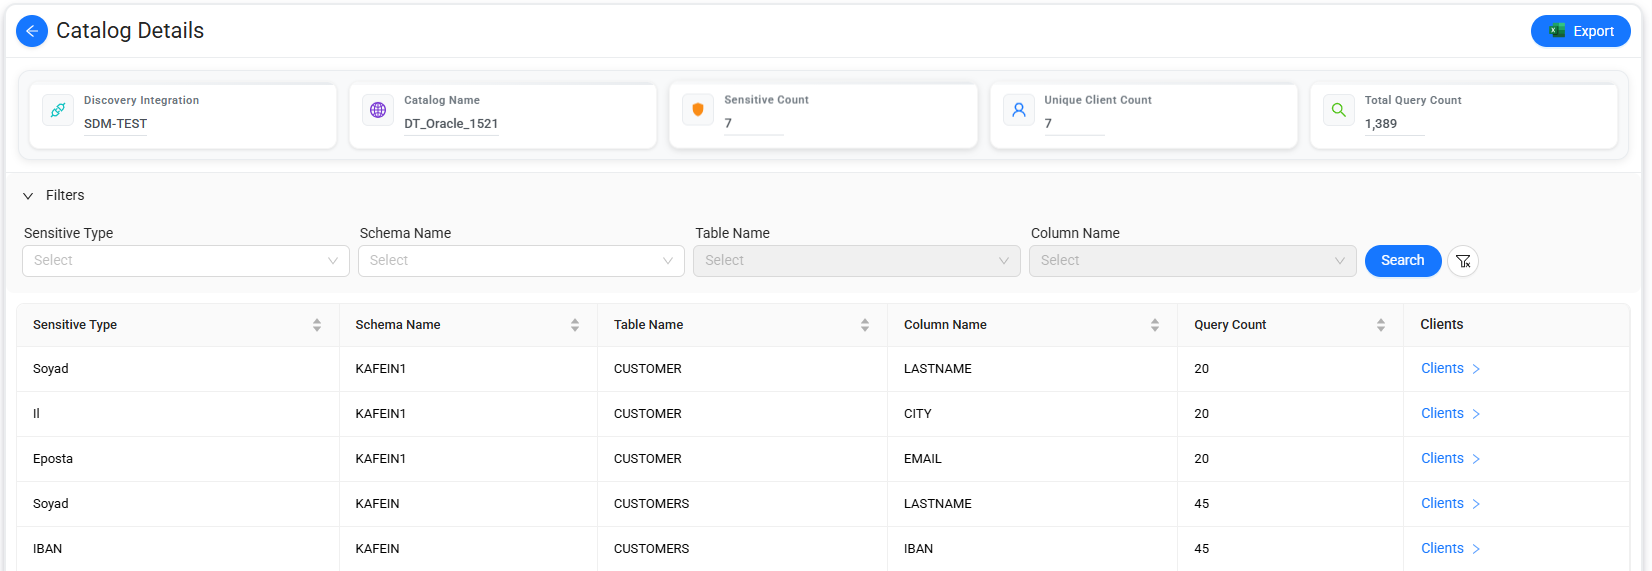
Summary cards at the top of the page display the following information:
| Item | Description |
|---|---|
| Discovery Integration | Discovery integration associated with the selected catalog. |
| Catalog Name | Name of the selected catalog. |
| Sensitive Count | Number of sensitive data findings associated with the catalog. |
| Unique Client Count | Number of unique clients that accessed data in the catalog. |
| Total Query Count | Total number of queries associated with the catalog. |
Catalog detail list
The results table provides sensitive-access information at the column level.
| Column | Description |
|---|---|
| Sensitive Type | Sensitive data type identified for the column. |
| Schema Name | Schema that contains the table. |
| Table Name | Table that contains the sensitive column. |
| Column Name | Column associated with the sensitive type. |
| Query Count | Total number of queries associated with the column. |
| Clients | Provides access to client-level access information for the selected sensitive column. |
View Client Access Details
Select Clients > for a row to open the Client Access Details page.
The Client Access Details page shows which clients accessed the selected sensitive data and provides query activity information for each client.
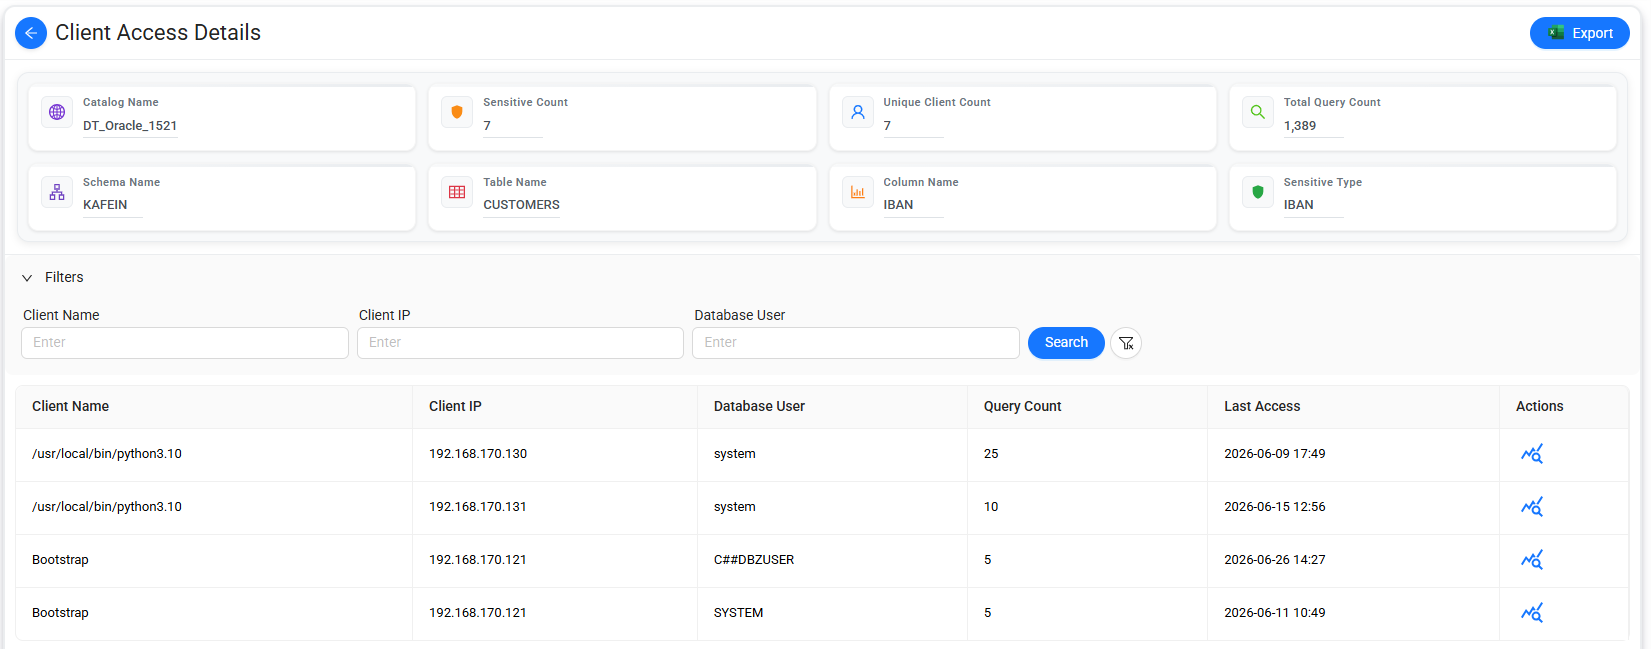
The page includes the following details:
| Column | Description |
|---|---|
| Client Name | Name of the client associated with the access activity. |
| Client IP | IP address of the client. |
| Database User | Database user associated with the access activity. |
| Query Count | Number of queries performed by the client. |
| Last Access | Date and time of the most recent access. |
You can also view the query associated with a client access record when query-level information is required.
Export Catalog Details
Select Export in the upper-right corner to export the displayed Catalog Details results to an Excel file.
If filters are applied, the export contains the filtered results.
Query Details
View query details
Select  for a client to view all queries associated with that client.
The query details are displayed as a list.
