Data Craft Usage
1. Database Connection (Initial Step)
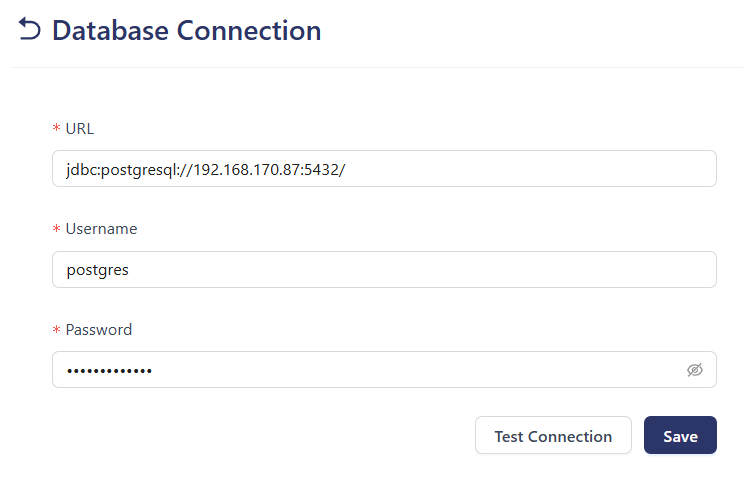
Before using the tool, configure your database connection. This is the required first step to enable access to all other functionalities.
-
URL (Required): Enter the database connection URL.
For example:
jdbc:postgresql://<IPaddressofhost>:<DBname> -
Username (Required): Enter the username used to access the database.
In the example, the username entered is:postgres -
Password (Required): Enter the password used for database access.
The input is masked for security reasons. -
Test Connection: Tests whether the database connection can be established with the provided information. Use this before saving to ensure the connection parameters are correct.
-
Save: Saves the database connection details into the system. It is recommended to use this button after a successful connection test.
All fields marked with an asterisk (*) are mandatory and must be filled in.
This step is essential to use all other features of the Data Craft tool.
If the connection information is incorrect, data-related operations in the following steps will not work.
2. Data Generation
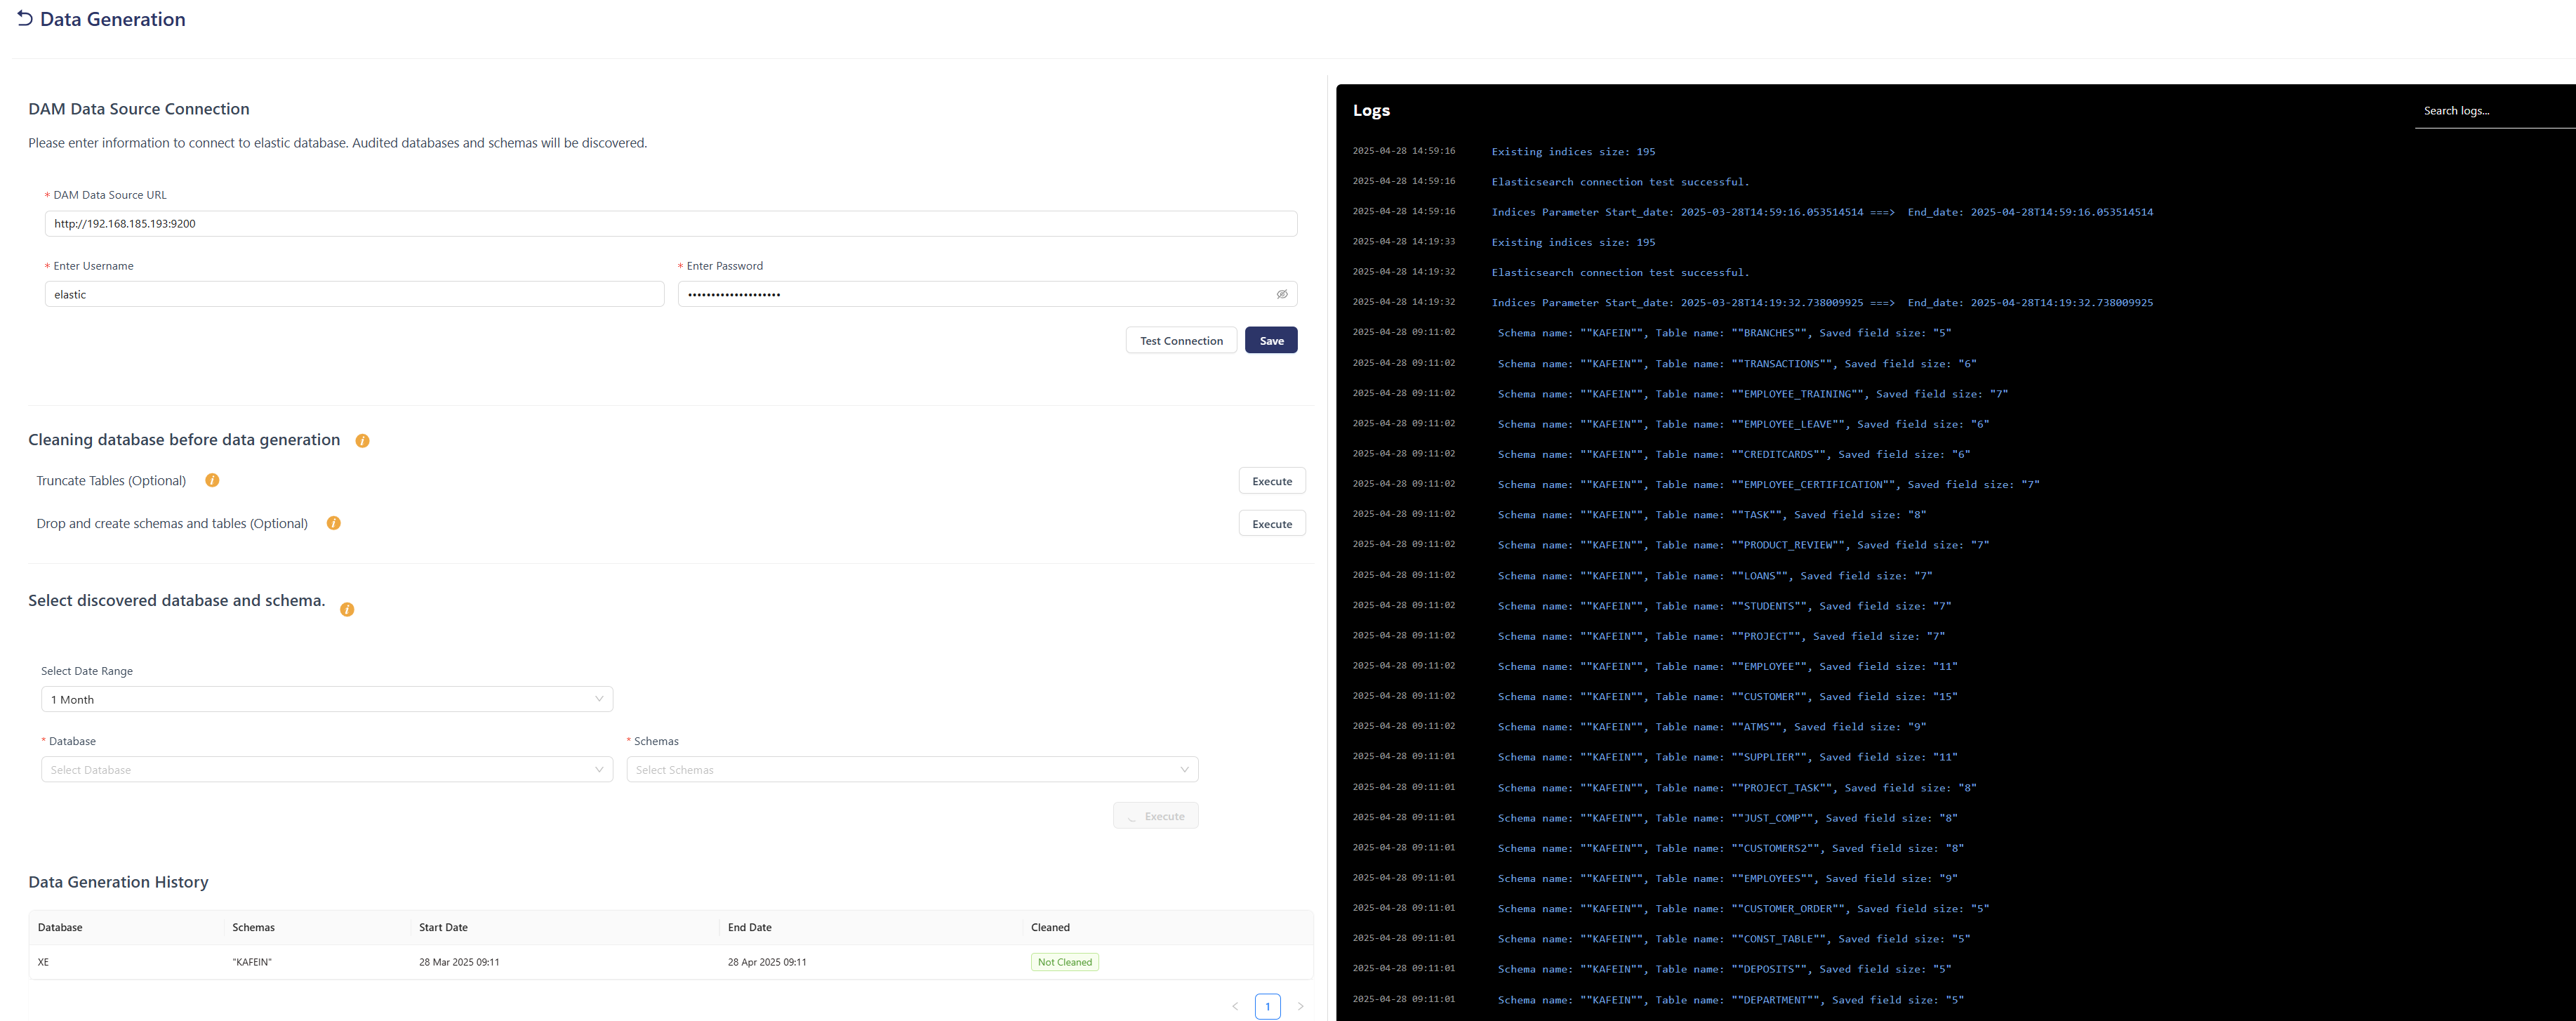
Data Generation is the second step in the process and involves connecting to the DAM data source, cleaning the target database, and utilizing the data in DAM to create database structures and schemas.
DAM Data Source Connection
- Enter the URL to connect to the DAM data source.
- Use Test Connection to verify the link.
- Use Save to store the connection settings.
Cleaning Database Before Data Generation
-
Truncate Tables (Optional): Removes all previously generated database, schema, table, column, and sensitive type entries from SDM schemas.
The results of this operation can be viewed in theCleanedcolumn of the Data Generation History table. -
Drop and Create Schemas (Optional): Drops and recreates the schemas related to SDM.
Select Discovered Database and Schema
- Select a Date Range.
- Based on the selected date range, choose the target Databases and Schemas.
- Then, click Execute to start the generation process.
Data Generation History
- Displays a record of previously executed data generation tasks.
- Includes details such as schema name, generation time, and selected date range.
Logs
- Displays logs on the right side of the page, refreshing every 5 seconds.
- Shows detailed information about data generation, such as: which tables received data, field sizes, any errors that occurred.
- Useful for monitoring and troubleshooting.
Sample Log Entries:
schema name: 'PUBLIC', table name: 'EMPLOYEE_TABLE', saved field size: '5'
schema name: 'PUBLIC', table name: 'DEPARTMENT', saved field size: '5'
Key Functions
-
Data Source Connection: A source database must be connected before generating any data.
-
Database Cleaning Options: Choose to truncate existing data or drop and recreate schemas before new data generation.
-
Schema and Database Selection: Select the target database and schema where data will be generated.
-
Date Range Definition: Specify the time range for which data should be created.
-
Operational Logs: View detailed logs for each operation, including success and error messages.
Mark Sensitive Data
This page is used to identify sensitive data within the database and assign appropriate tokenization or masking methods.
Note: The databases and schemas created in the first step are displayed on this screen.
- Select the relevant Database, Schema, Table, and Column.
- Choose an appropriate Tokenization/Masking Type for the sensitive data.
- Click the Save button to apply the configuration.
- You can track previous operations in the History section below.
Screen Options
-
Apply to All Tables: Applies the selected sensitive type to all columns of all tables in the selected schema.
-
Apply to All Columns: Randomly assigns sensitive types to all columns of the selected table.
-
Clear: Clears all previously selected actions and resets the form.
-
Execute: Executes the sensitive type assignment based on selected parameters.
History
Displays a record of previously performed sensitive data tagging operations. Currently, the table shows a "No Data" message. The History Table contains the following columns: Database, Schema, Semitoken Count, Run Date, Status, and Action.
Logs
Displayed on the right side of the page and updated every 5 seconds. Logs include which tables were populated, field sizes, and any errors that occurred. This section is useful for monitoring and troubleshooting sensitive data operations.
Sensitive Details
The Sensitive Details page shows all database tables and the number of columns within each table that are marked as containing sensitive data. It helps users to easily identify which tables include sensitive information and how widespread it is.
Note: Users can click the Details button under the History section on the Mark Sensitive Data page to reach Sensitive Details.
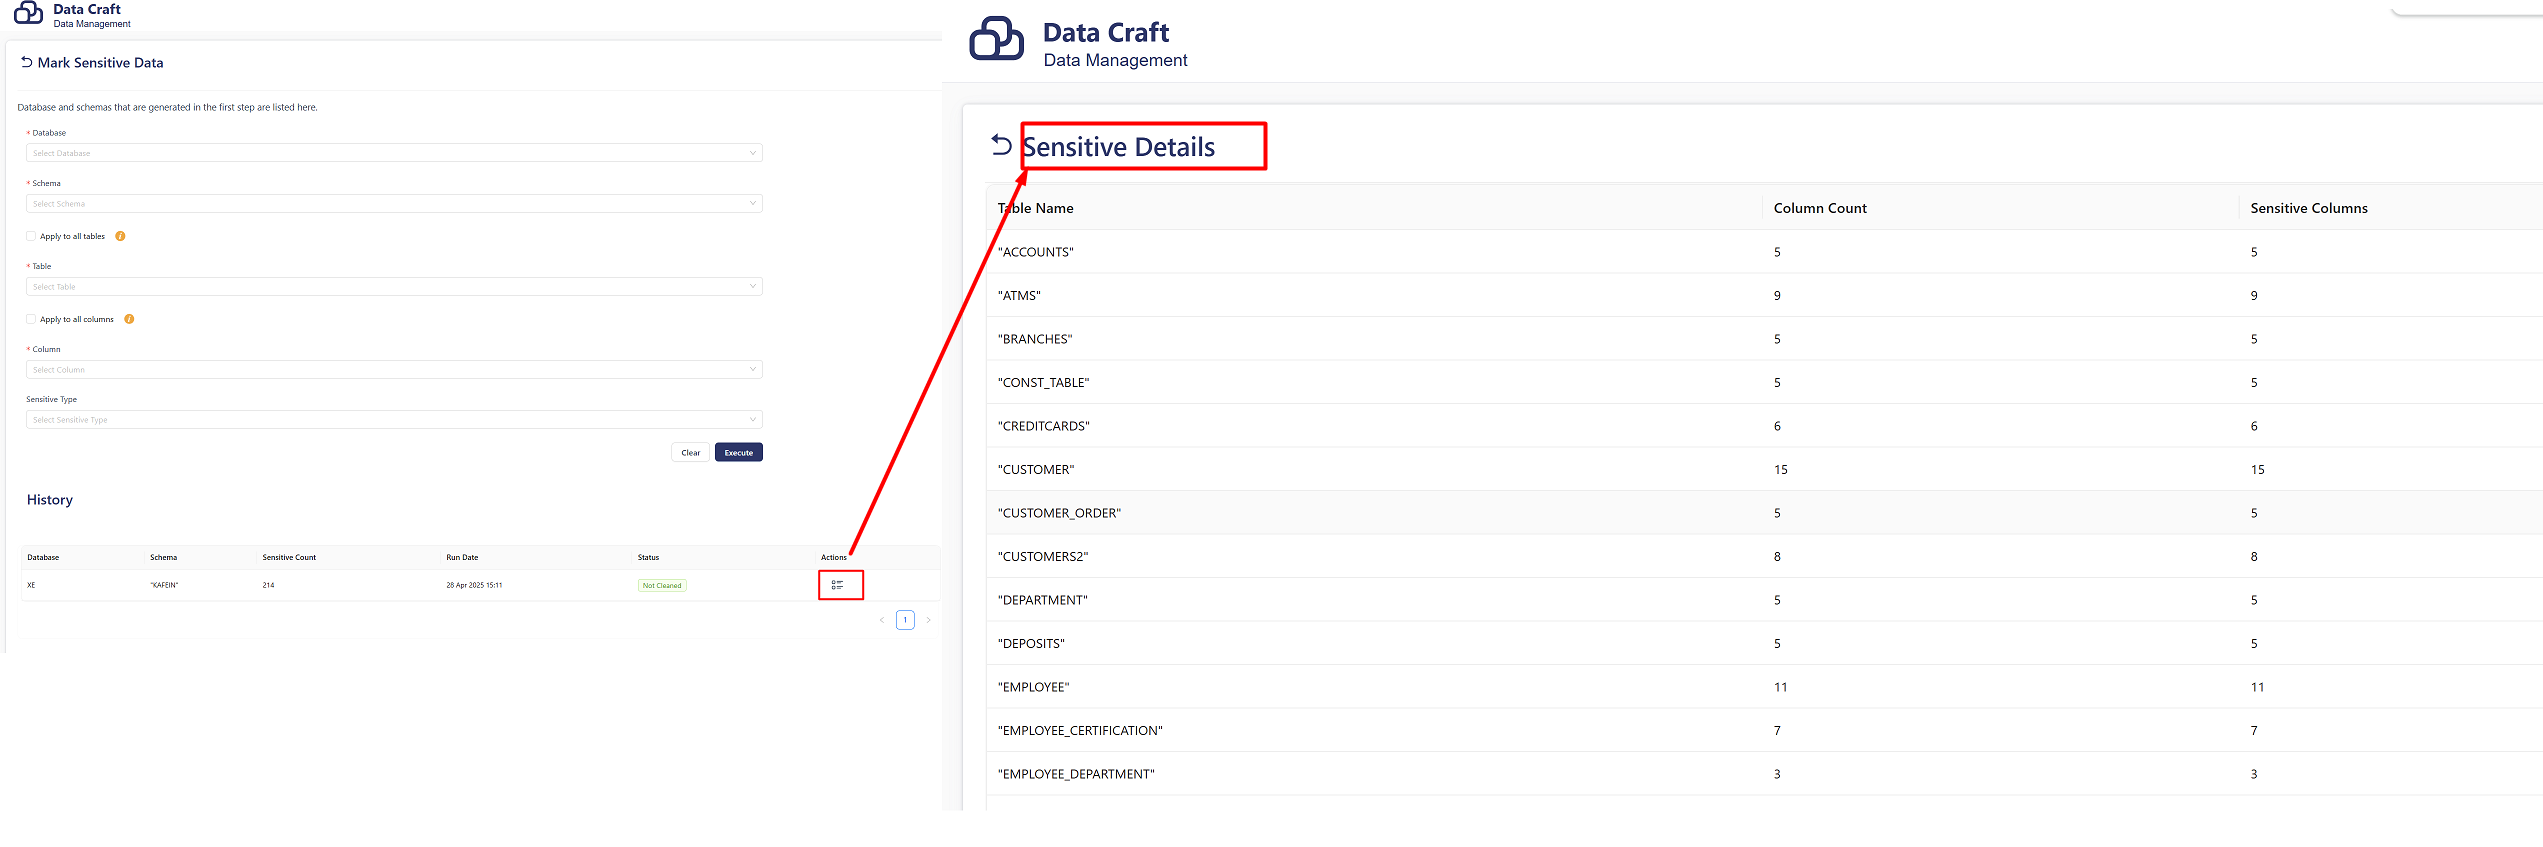
Through this page, users can perform the actions listed below.
- View a high-level summary of the sensitive data distribution across tables.
- Identify tables that contain more sensitive fields.
- Prioritize certain tables for data protection actions.
On-Screen Sections
1. Table List
Lists database tables such as: ACCOUNTS, BRANCHES, CONST_TABLE etc.
2. Column Information
For each listed table, two key metrics are displayed:
- Columns Count: Total number of columns in the table
- Sensitive Columns: Number of columns marked as sensitive
3. Example Data
Some sample sensitive column distribution from the screen:
ACCOUNTS: 3 out of 4 columns are sensitiveBRANCHES: 3 out of 5 columns are sensitiveCONST_TABLE: All 2 columns are sensitive
This screen helps users gain insight into the scope of sensitive data across database tables, making it easier to track and manage data security compliance.
Create Audit Data
Audit Data page displays the list of created queries (initially shows a No Data message).
- Top-right buttons:
- Connections: Shortcut to connection management.
- New Query: Opens the query creation form.
- Logs Panel on the right shows query execution history and results (initially empty).
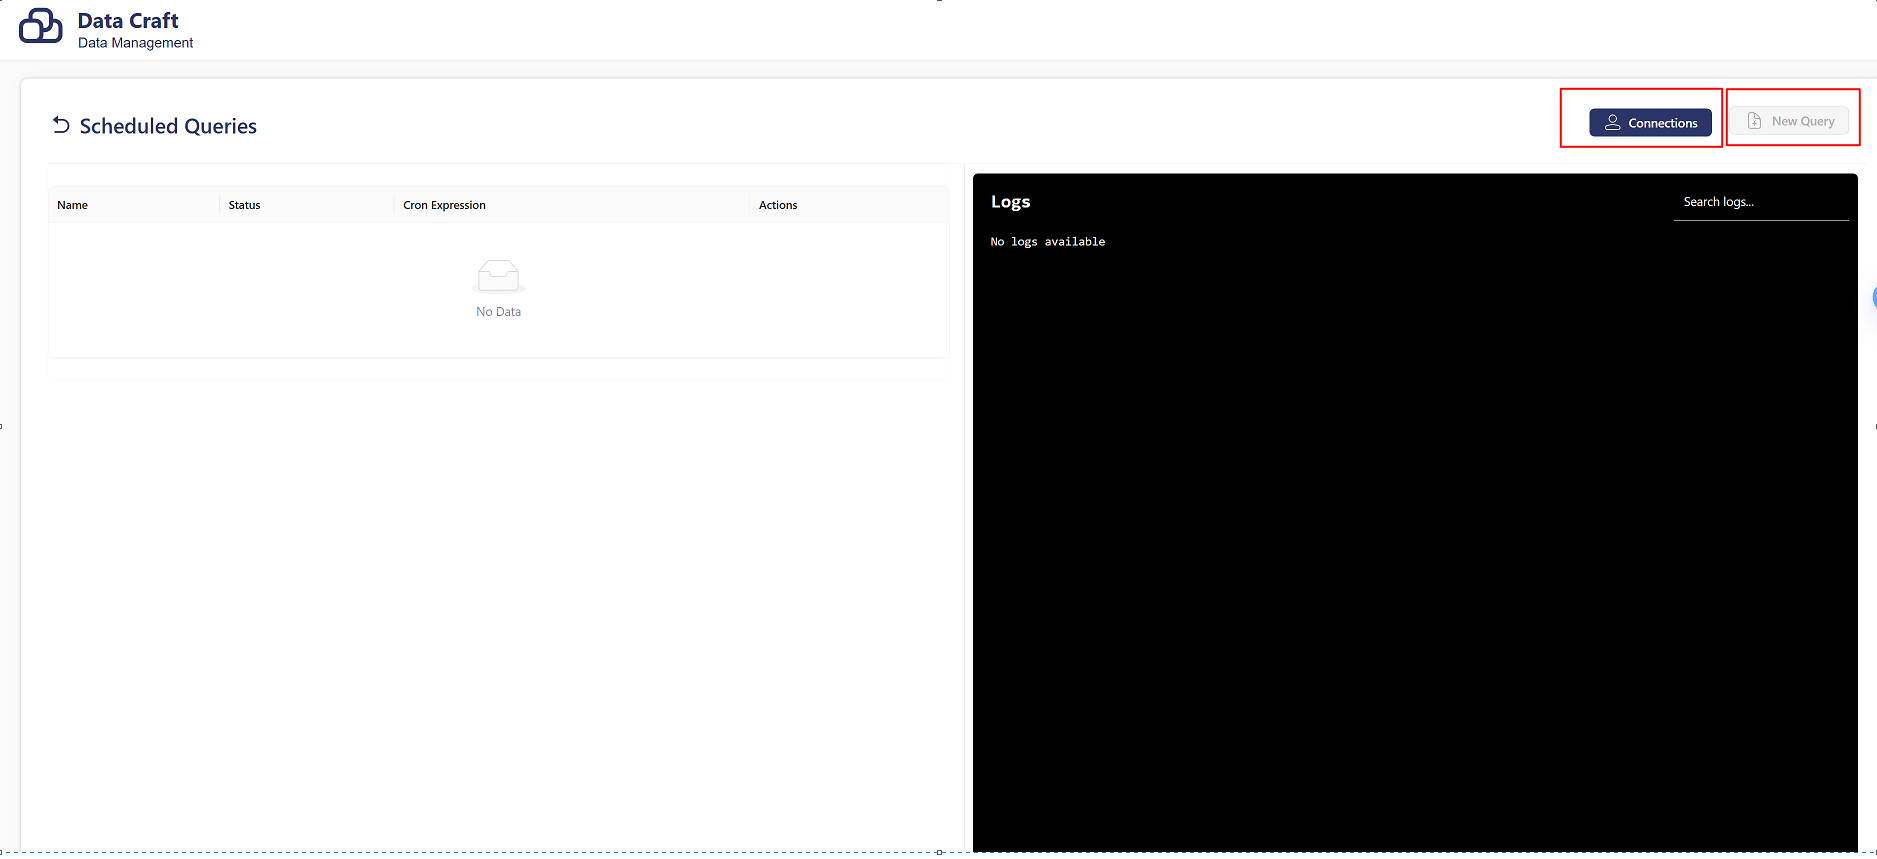
The process of creating audit data in the Data Craft application follows a structured sequence. Before creating scheduled queries, database connections must be defined. Queries run based on these established connections.
New Connection
To define database connections enter the required fields: Name, Database Type, Host, Port, Database Name, Username, and Password.
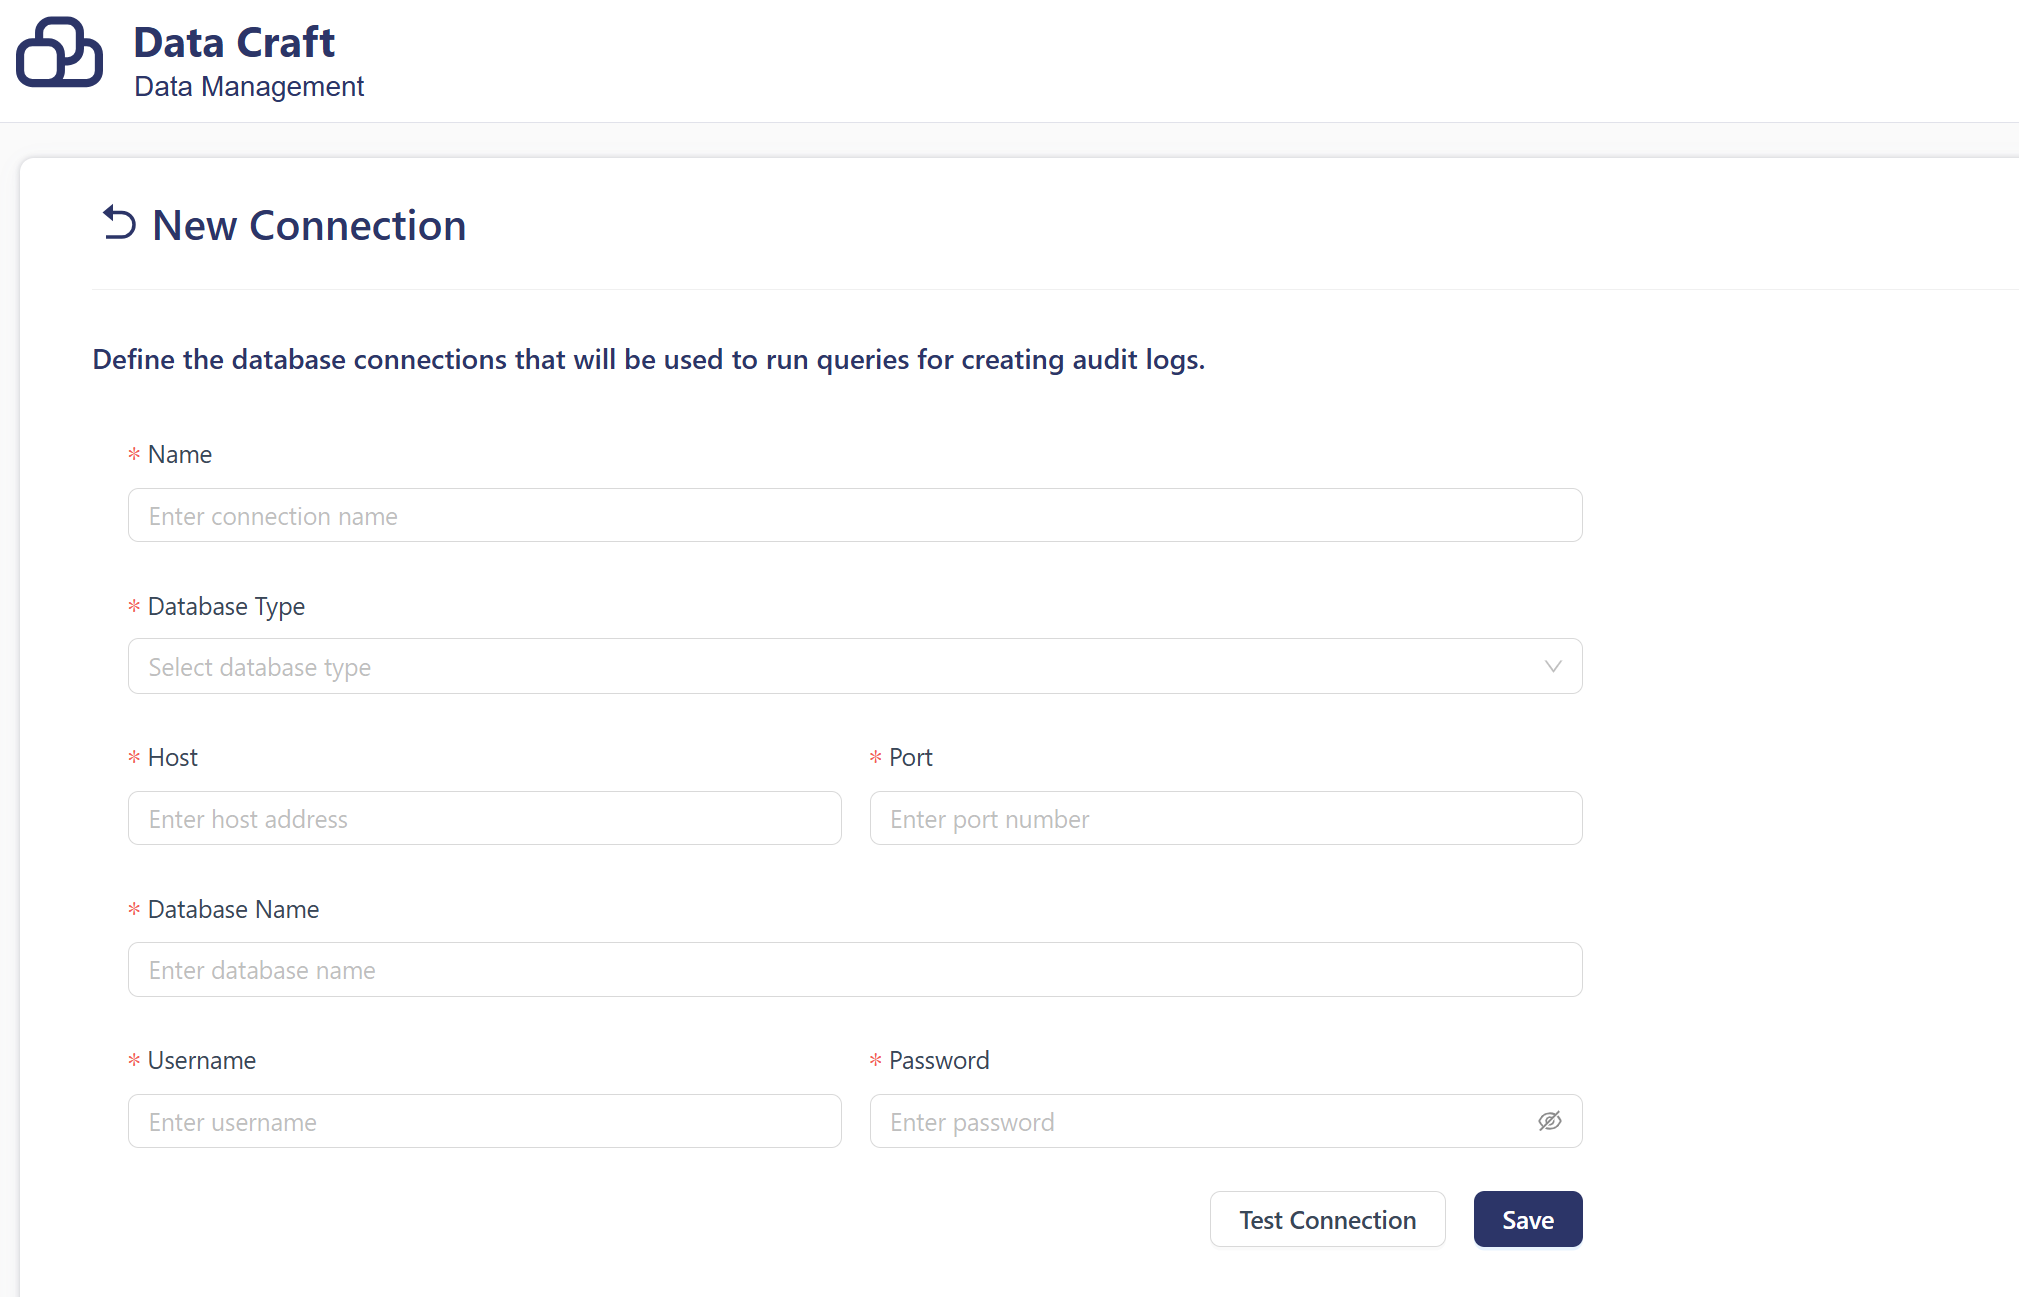
After entering connection details:
- Use Test Connection to check connectivity.
- Click Save to store the connection.
A maximum of 5 users can be defined per database.
A single connection can be used in up to 3 queries.
Scheduled Queries
Once a database connection is established, scheduled queries can be created.
New Query Page
Used to define a scheduled query to generate audit data.
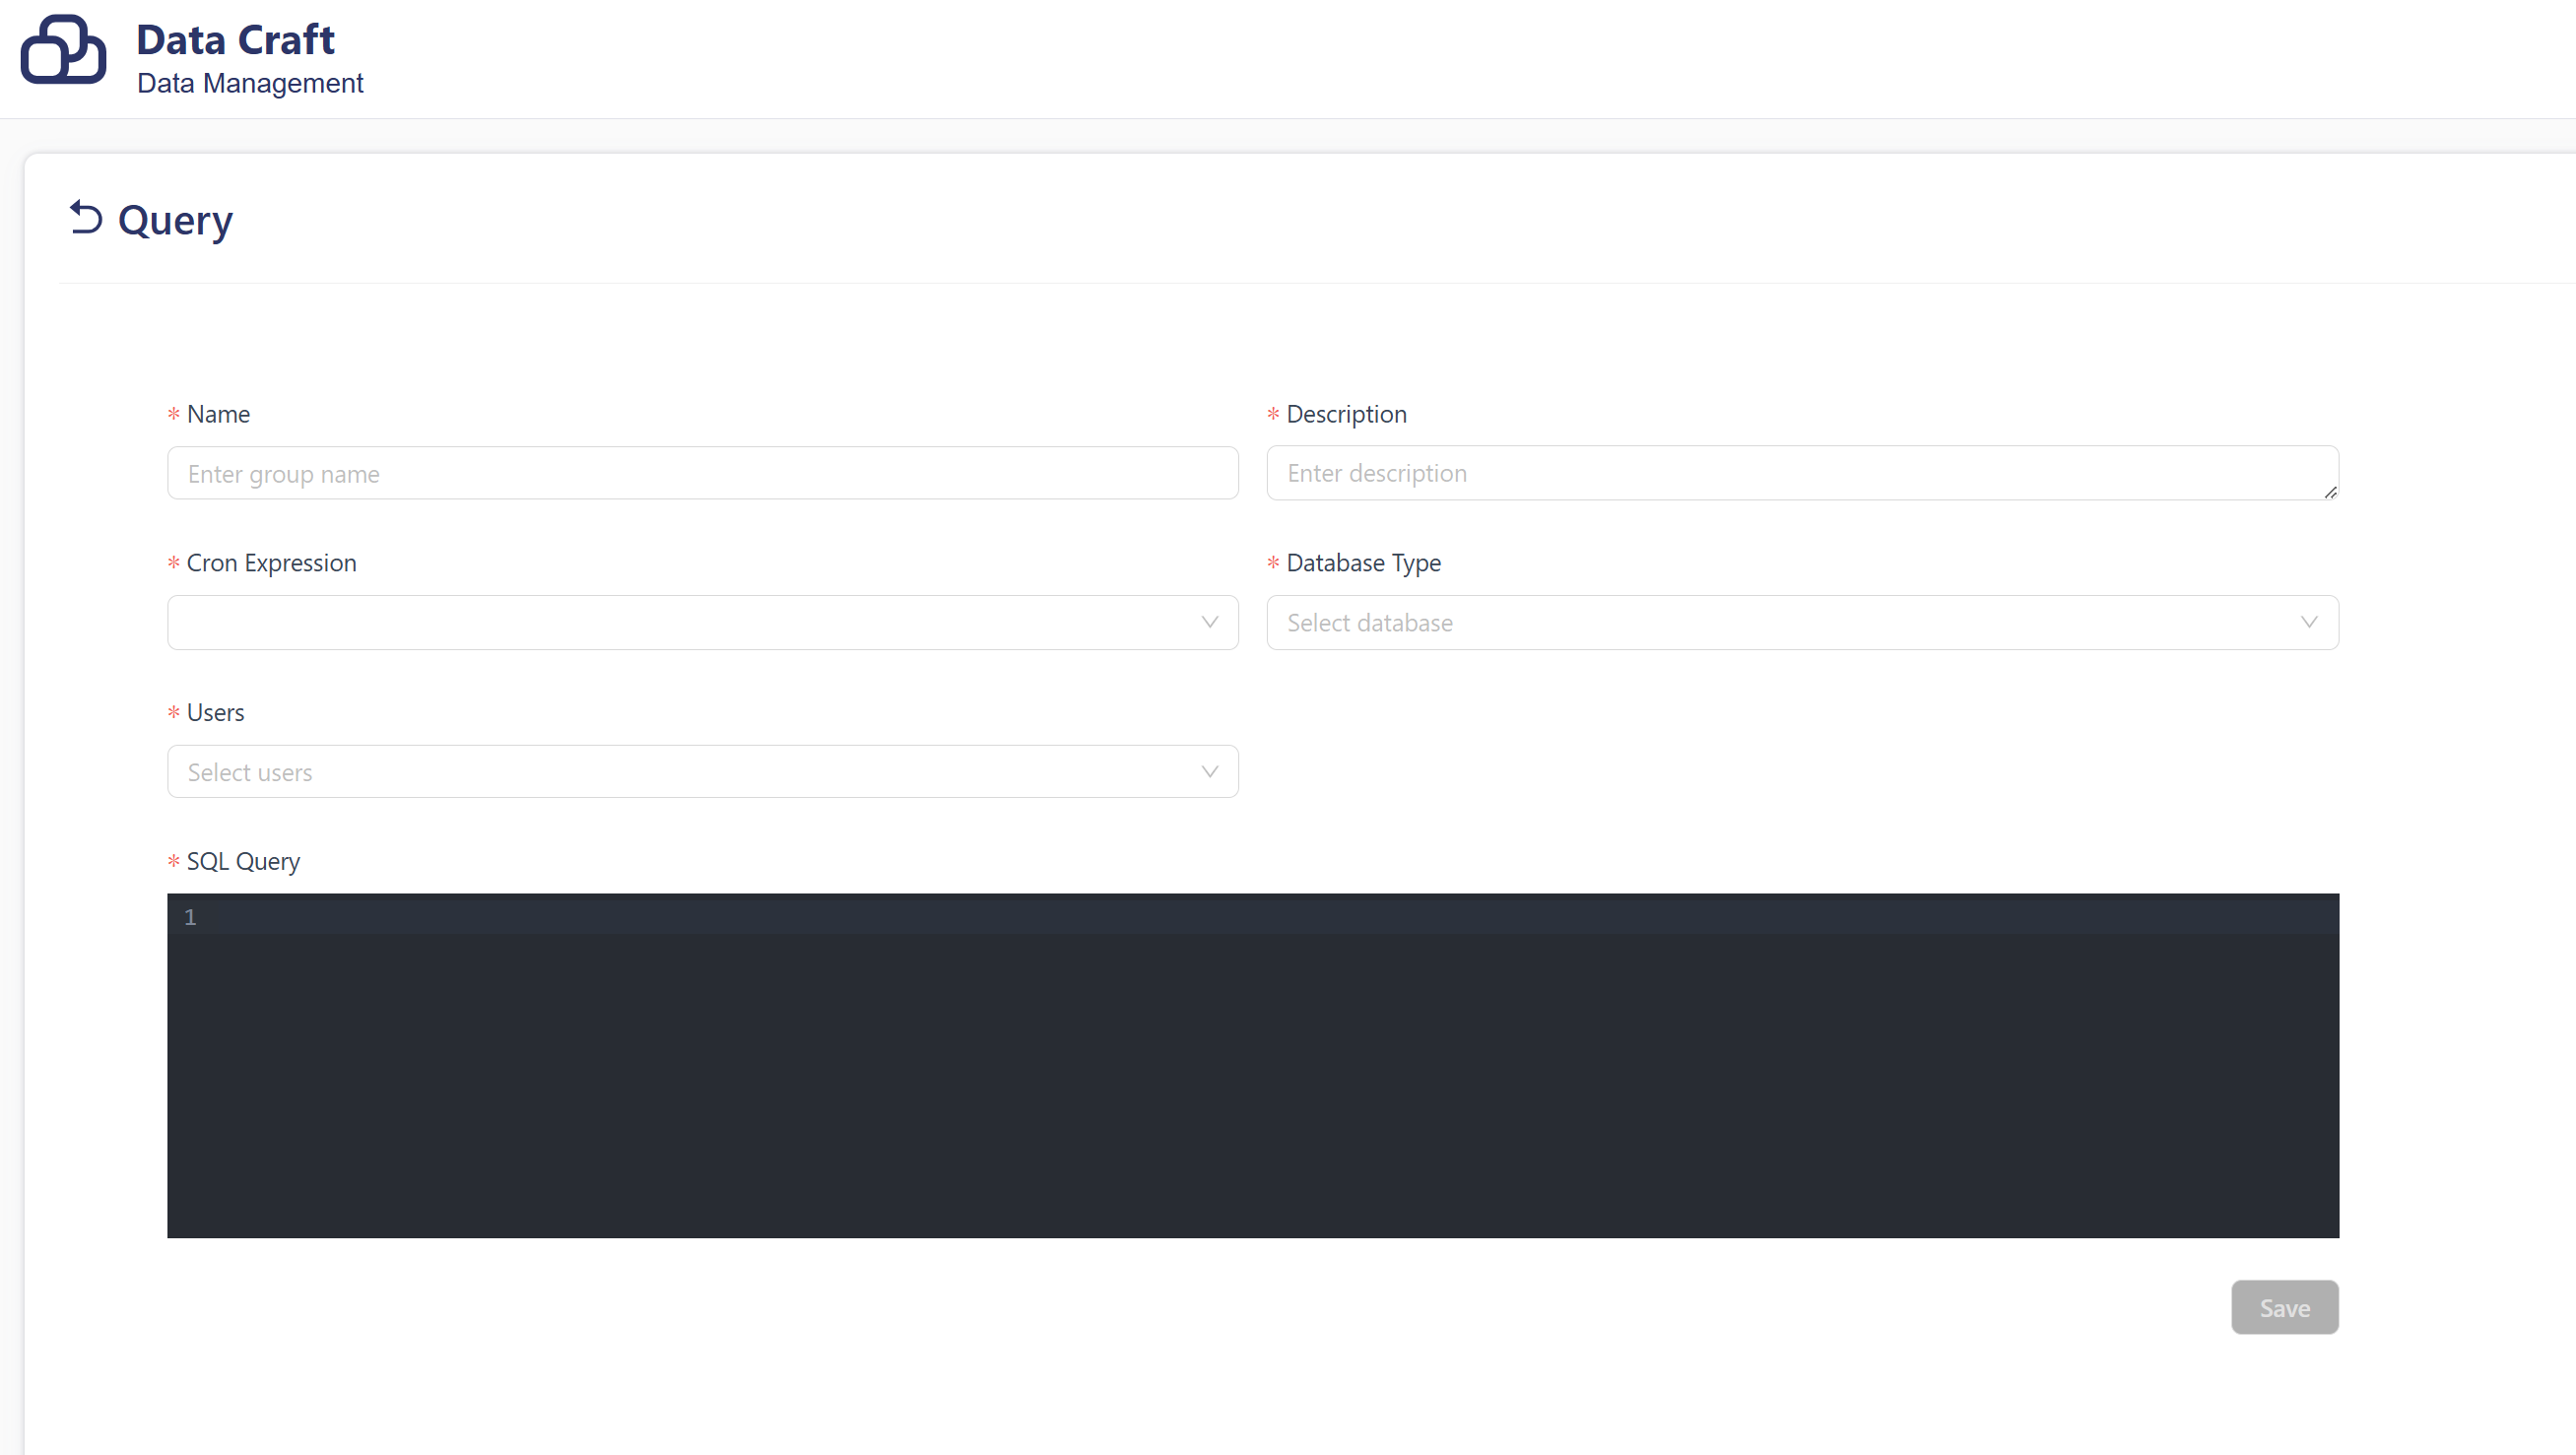
- Name: Name of the scheduled query.
- Description: Description of what the query does.
- Cron Expression: Defines how frequently the query will run (e.g., every day at midnight).
- Database Type: Type of the database where the query will be executed; selected from predefined connections.
- Users: List of database users who will execute the query.
- SQL Query: The SQL statement that will be executed on schedule.
After filling in all details, click Save to store the scheduled query.
Important Conditions
-
Connection First, Then Query
A database connection must exist before a scheduled query can be created. -
Query–Connection Binding
Queries are bound to pre-defined connections. TheDatabase Typefield in the query form pulls data from existing connections. -
Audit Data Generation Workflow
- Step 1: Define database connections in the Connections page.
- Step 2: Create scheduled queries in the Scheduled Queries page using the New Query button.
- Step 3: Queries run automatically at the scheduled times and generate audit logs.
- Step 4: Query results and logs appear in the Logs Panel.
This process ensures that audit data is created systematically and automatically, enabling efficient data governance and monitoring.
Health Check
Health check page is used to check the health status of the application through the Data Touch interface.
Use this feature regularly to ensure that the system is functioning properly.
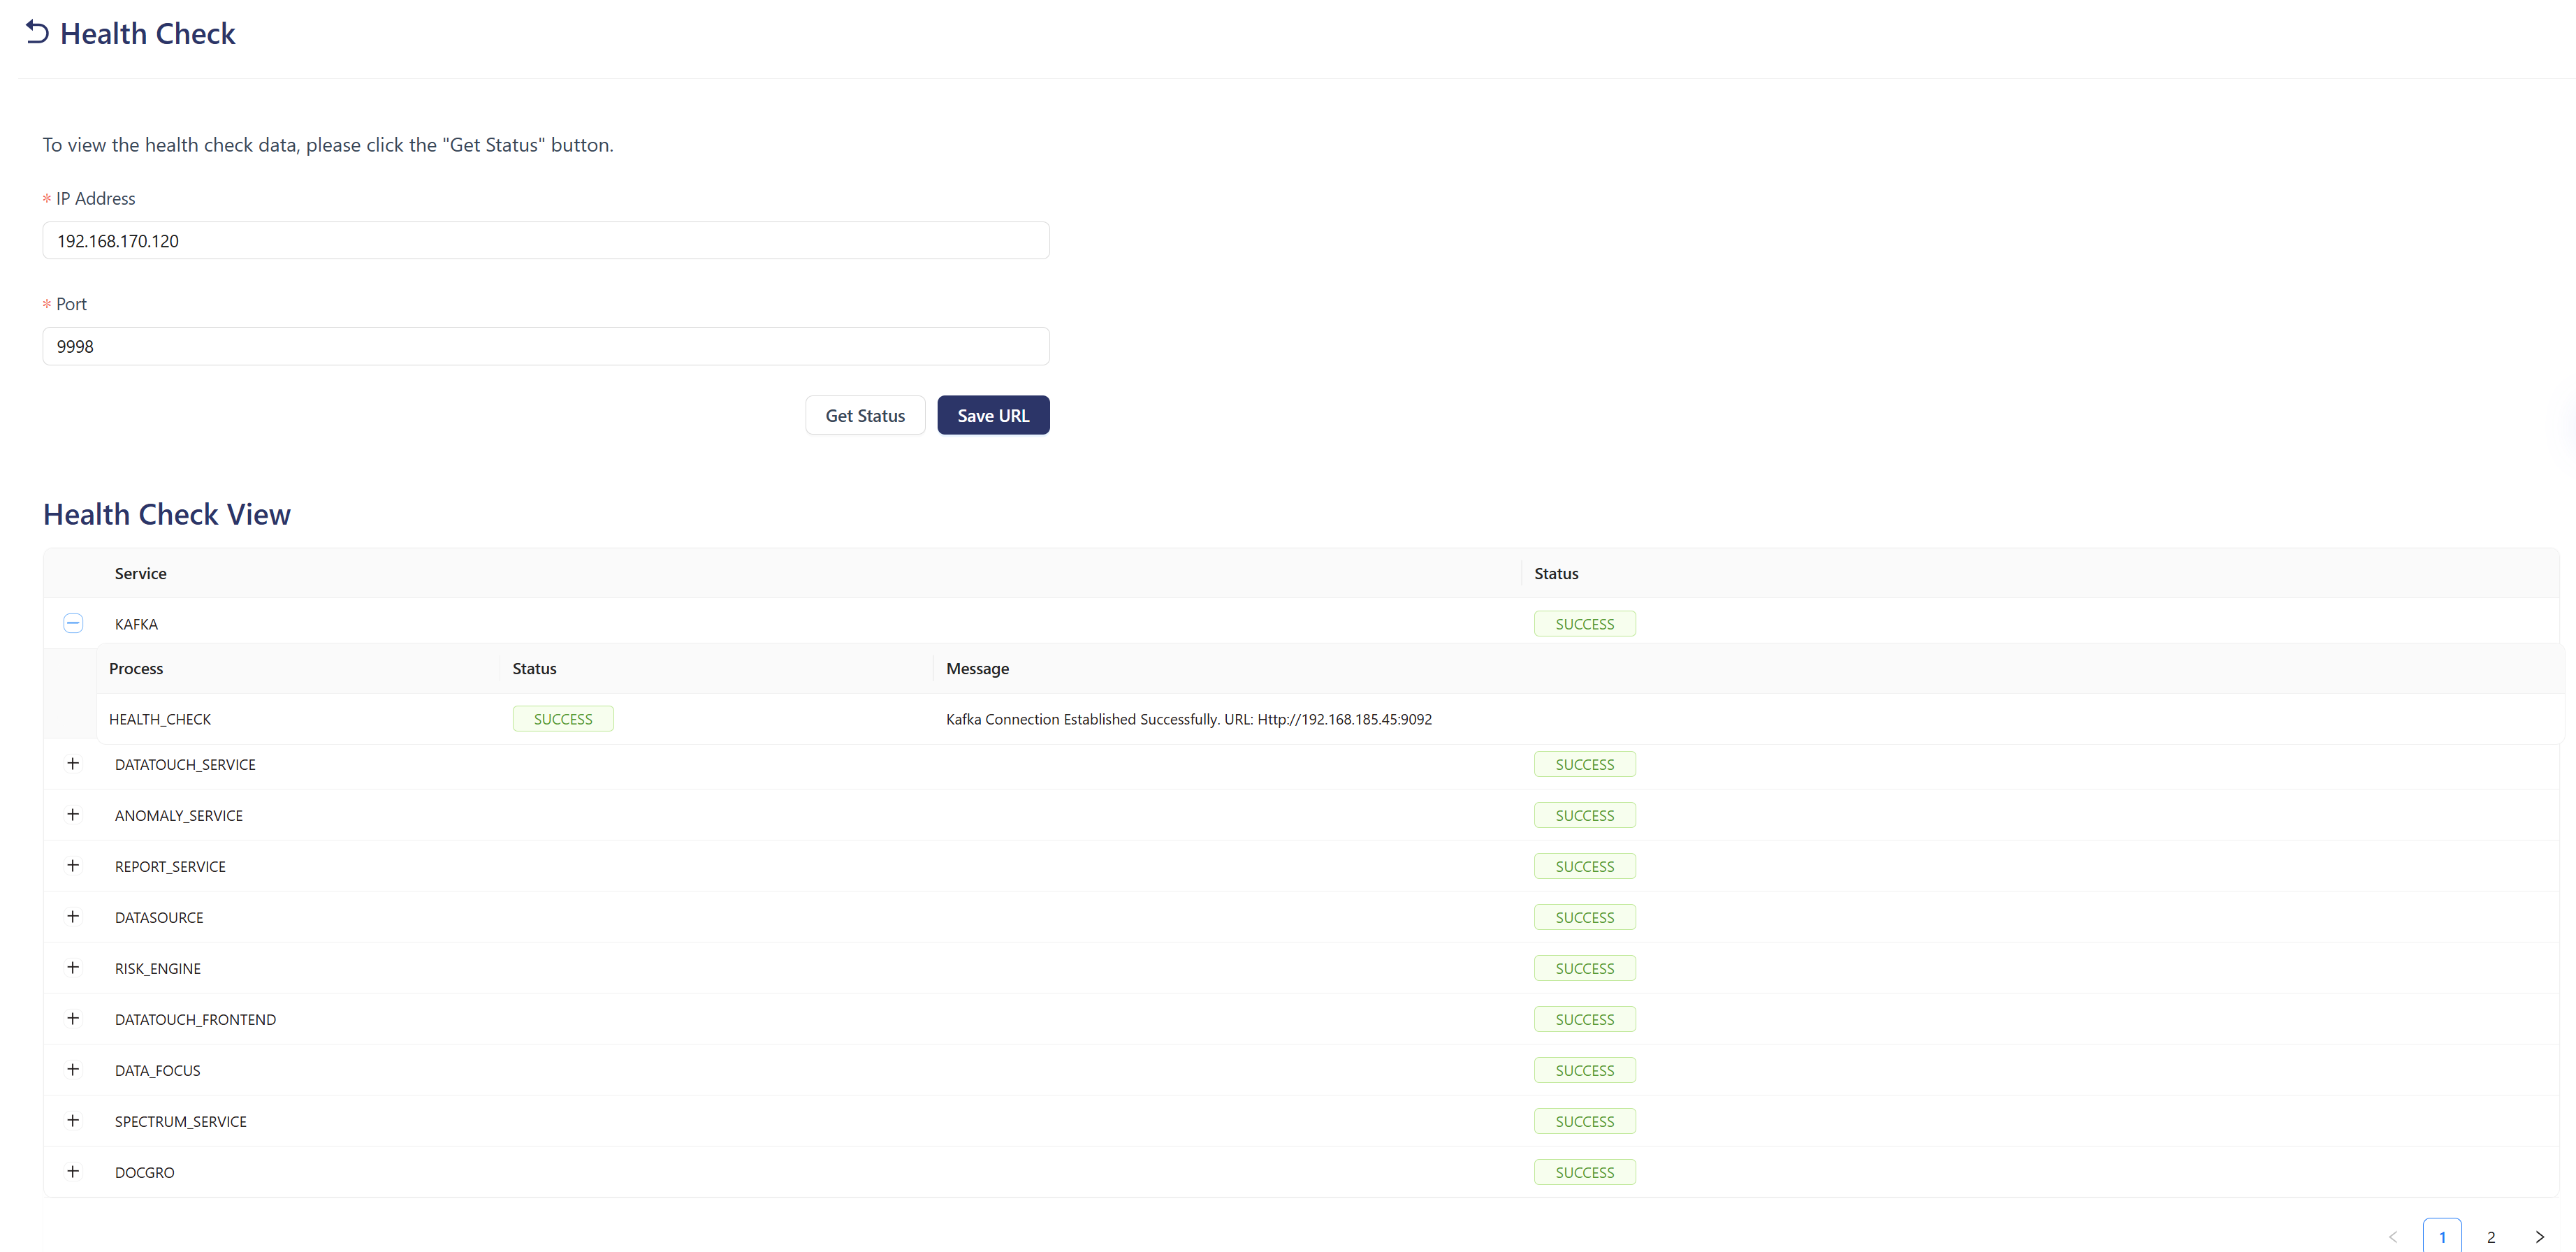
Connection Parameters (Top Section)
- IP Address: IP address used to connect (e.g., 192.168.1.1)
- Port: Port number (e.g., 9098)
- Get Status: Starts the health check process
- Save URL: Saves the entered IP and port information
Health Check Results (Bottom Section)
- Service: Name of the service (e.g., KAFKA)
- Status: Result of the health check (e.g., SUCCESS)
Example Service Status List
| Process | Status |
|---|---|
| HEALTH_CHECK | SUCCESS |
| DATATOUCH SERVICE | SUCCESS |
| ANOMALY SERVICE | SUCCESS |
| REPORT SERVICE | SUCCESS |
| DATASOURCE | SUCCESS |
| RISK ENGINE | SUCCESS |
Usage Purpose
- Monitor the live status of all Data Craft system components
- Quickly detect interruptions or failures in services
- Check operational status of critical infrastructure components like Kafka
- Provide actionable insights for incident response
Operational Flow
- Enter IP and Port information (or use saved values)
- Click Get Status to run the health check
- System evaluates the availability of all services
- Results are displayed in the Health Check View
- Status is shown as SUCCESS or an error message
- Click Save URL to store connection settings