Heatmaps
The Heatmaps page can be accessed directly from the menu or from a data source on the Data Sources page.
The following heatmap types are available:
- Table Query Count Heatmap
- Client Count Heatmap
- Table Action Type Query Count Heatmap
To create a heatmap:
- Select a Discovery Integration.
- Select a Catalog Name.
- Select a heatmap type.
- Configure the available filters.
- Select Create.
The generated heatmap is displayed directly on the page.
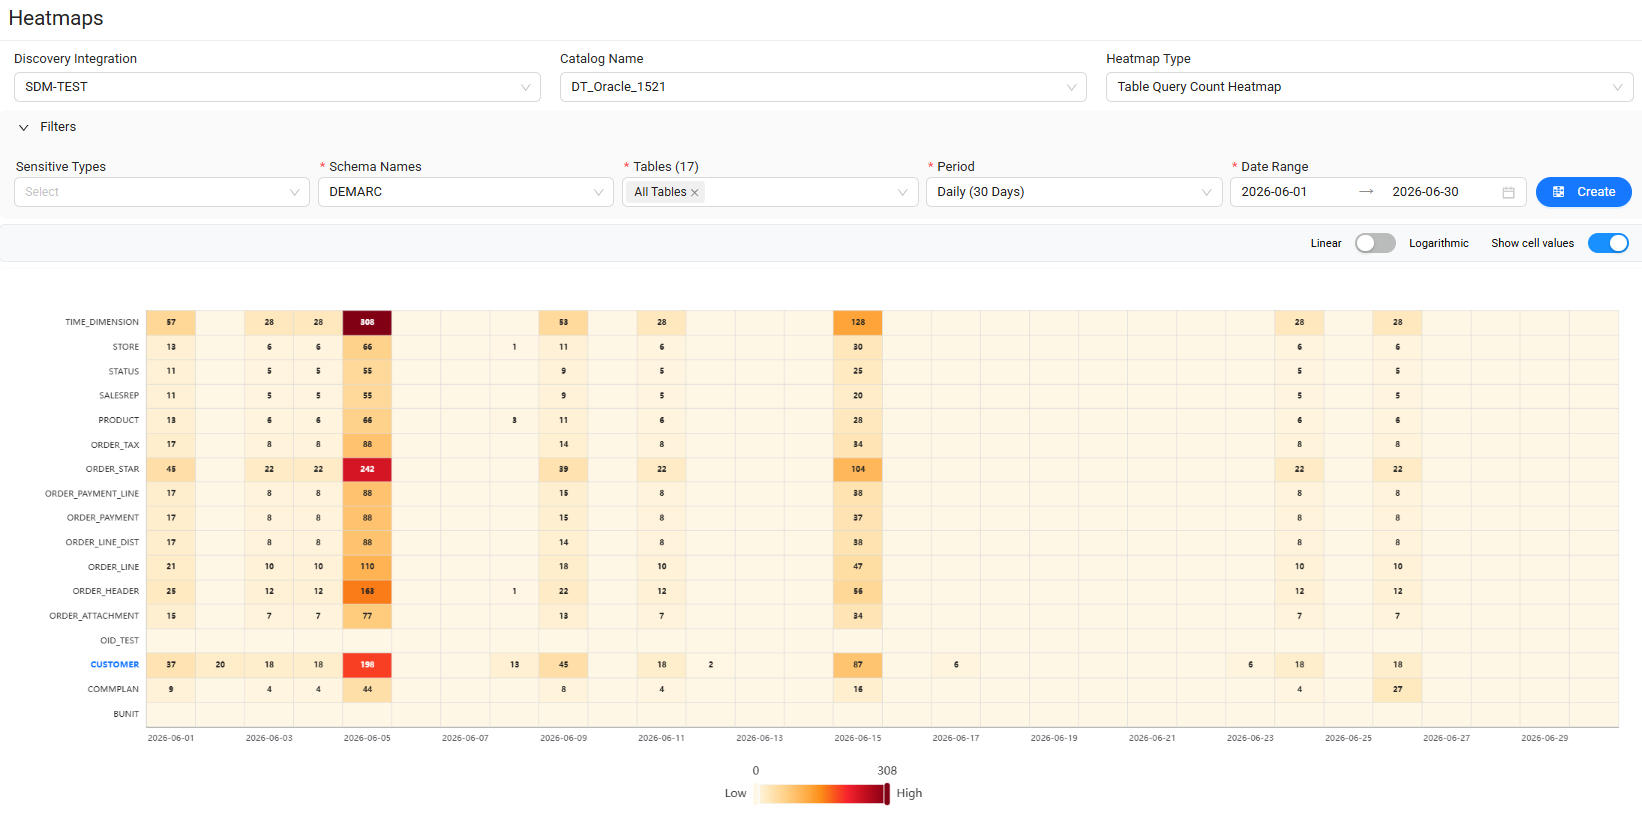
Table Query Count Heatmap
The Table Query Count Heatmap shows the total number of queries for each table during the selected period.
You can filter the heatmap by:
- Sensitive Type
- Schema Name
- Table Name
- Period
- Date Range
After configuring the filters, select Create.
Client Count Heatmap
The Client Count Heatmap shows the number of queries performed by each client against each table during the selected period.
You can filter the heatmap by:
- Client Name
- Sensitive Type
- Schema Name
- Table Name
- Date Range
After configuring the filters, select Create.
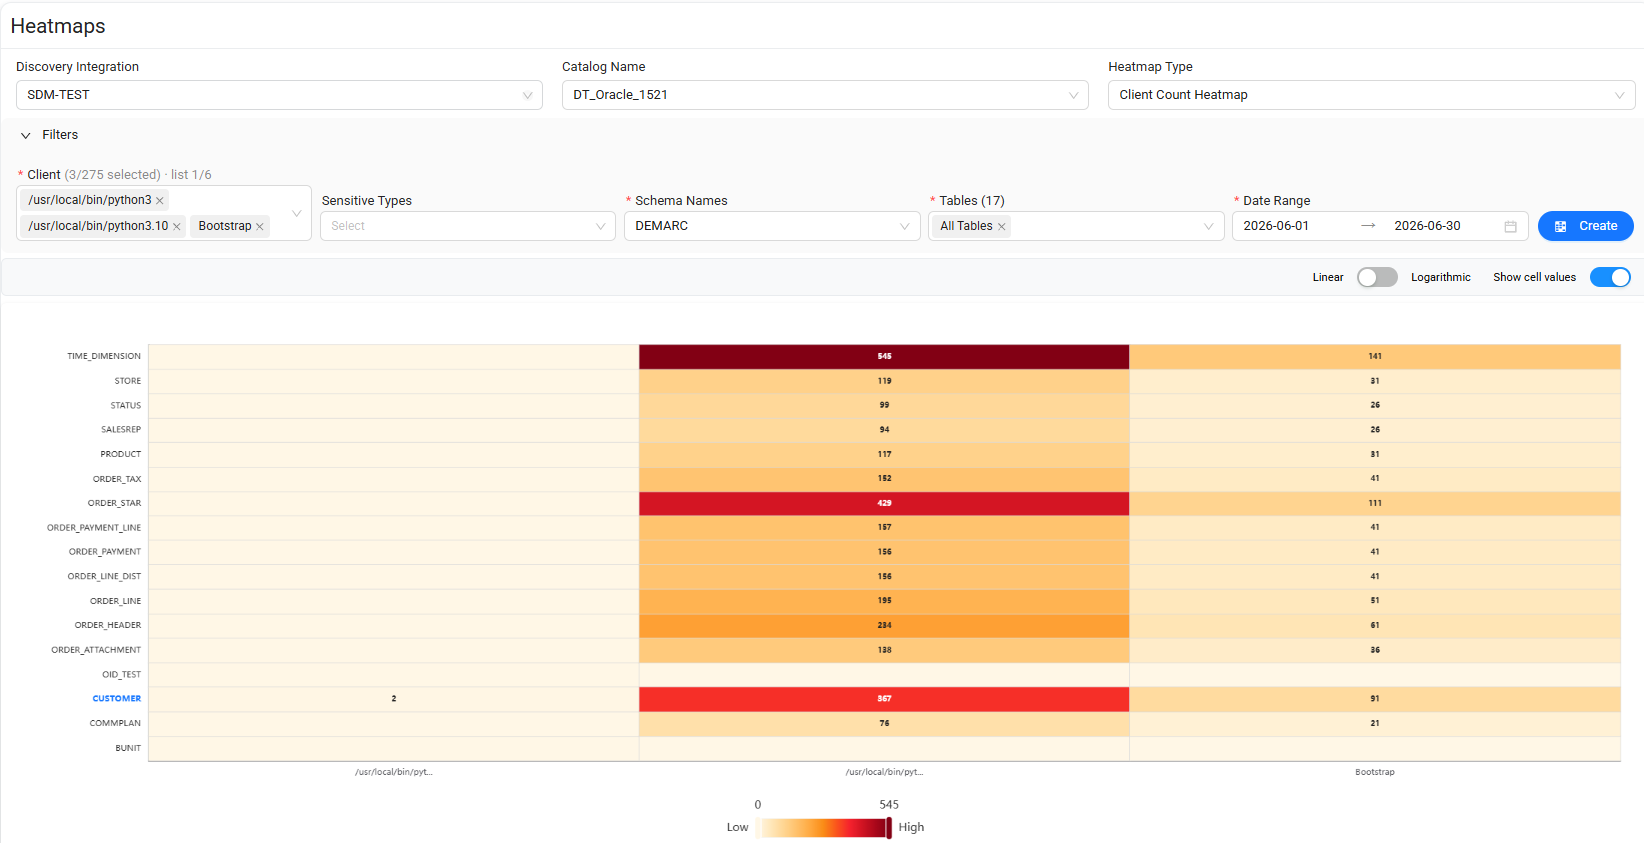
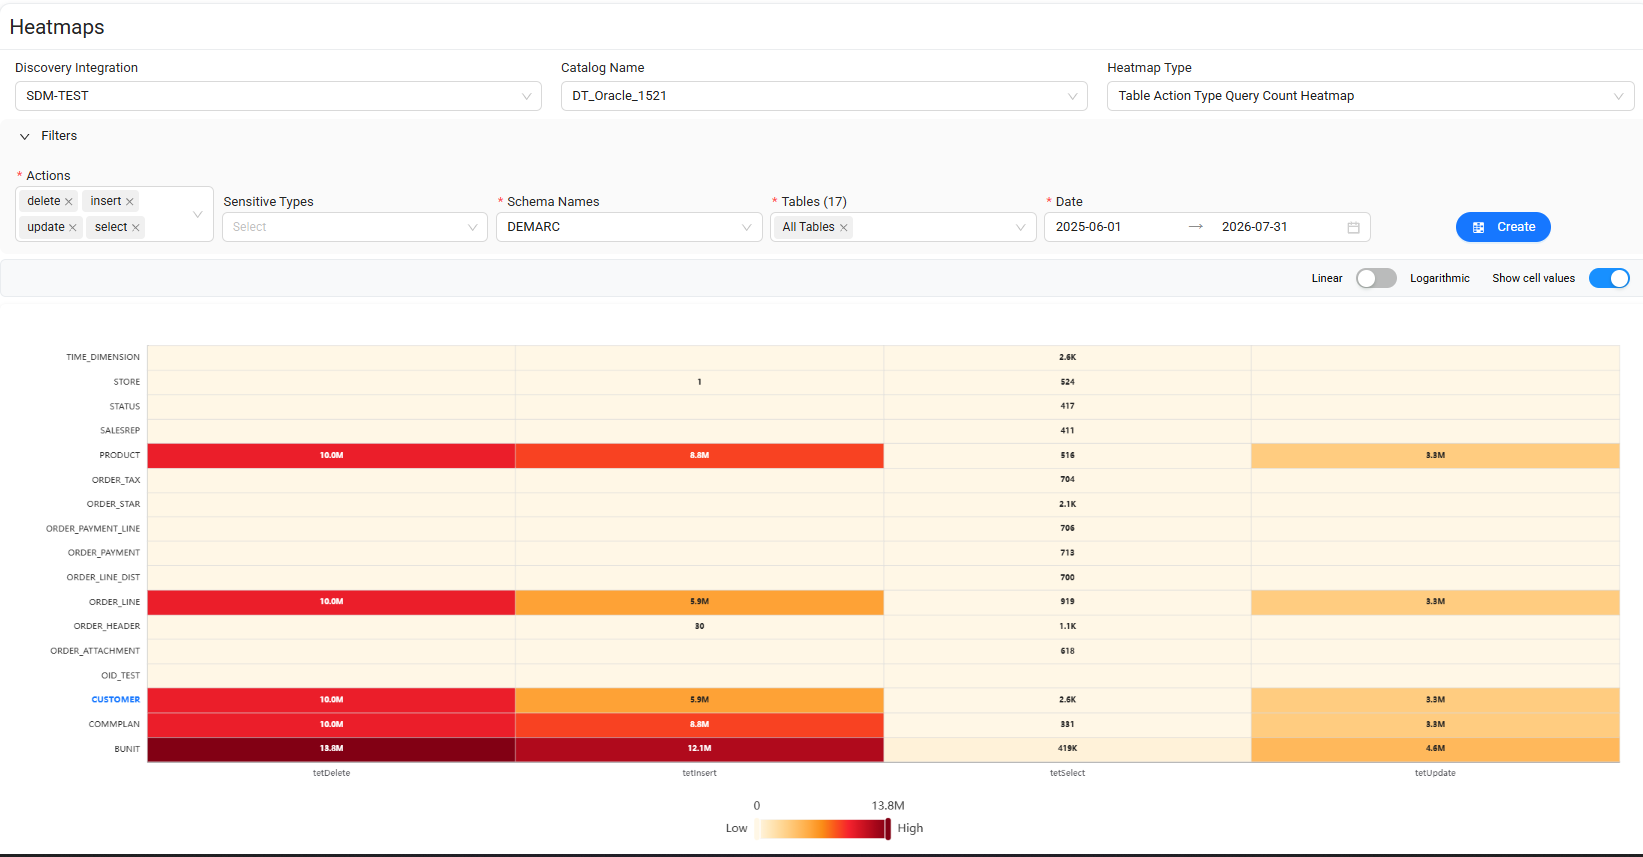
Table Action Type Query Count Heatmap
The Table Action Type Query Count Heatmap shows the number of queries for each table, grouped by action type.
Action types can include operations such as:
- SELECT
- UPDATE
- DELETE
You can filter the heatmap by:
- Action Type
- Sensitive Type
- Schema Name
- Table Name
- Date Range
After configuring the filters, select Create.