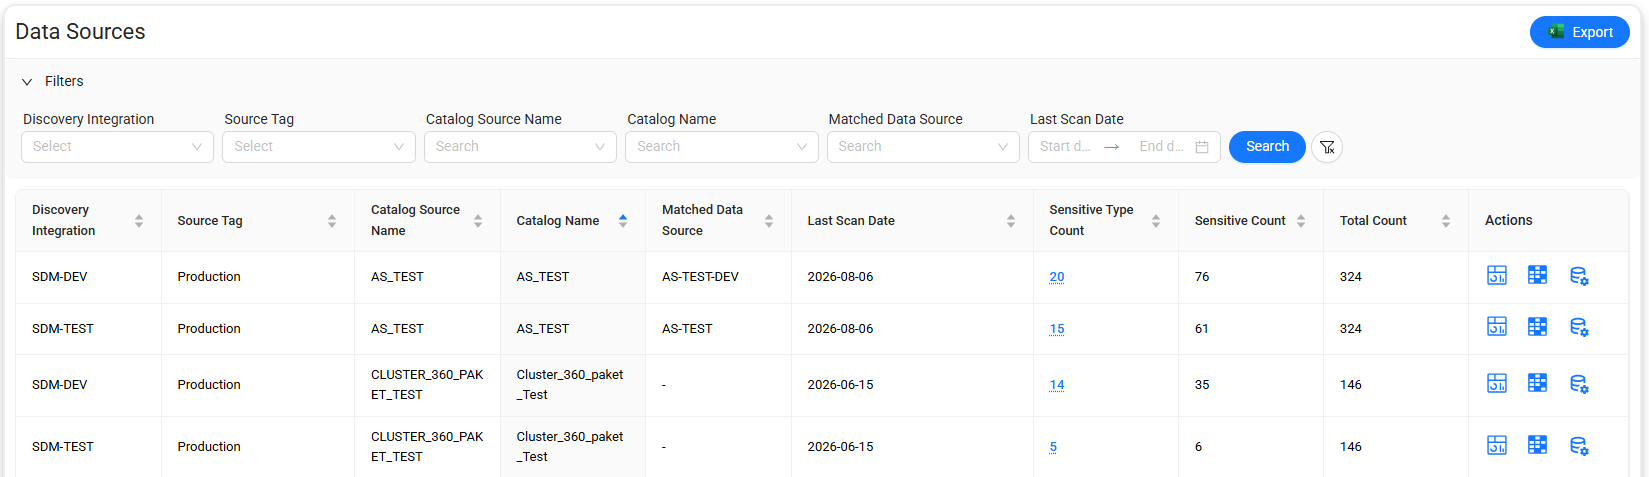
Data Sources
The Data Sources page displays all available data sources in a list.
You can search for and filter data sources by using one or more of the following filters:
- Discovery Integration
- Source Tag
- Catalog Source Name
- Catalog Name
- Matched Data Source
- Last Scan Date
To filter the list:
- Select or enter the required filter criteria.
- Select Search.
To export the filtered list to an Excel file, select Export.
The following actions are available for each data source:
-
Data Source Dashboard

Opens the Source Dashboard page, which provides detailed analytics for the selected data source. -
Data Source Heatmap

Opens the Heatmaps page, where you can create and review detailed heatmaps for the selected data source. -
Ledger Definition

Opens the ledger definition page in Ledger Management, where you can define or manage the ledger for the selected data source.
Data Source Dashboard
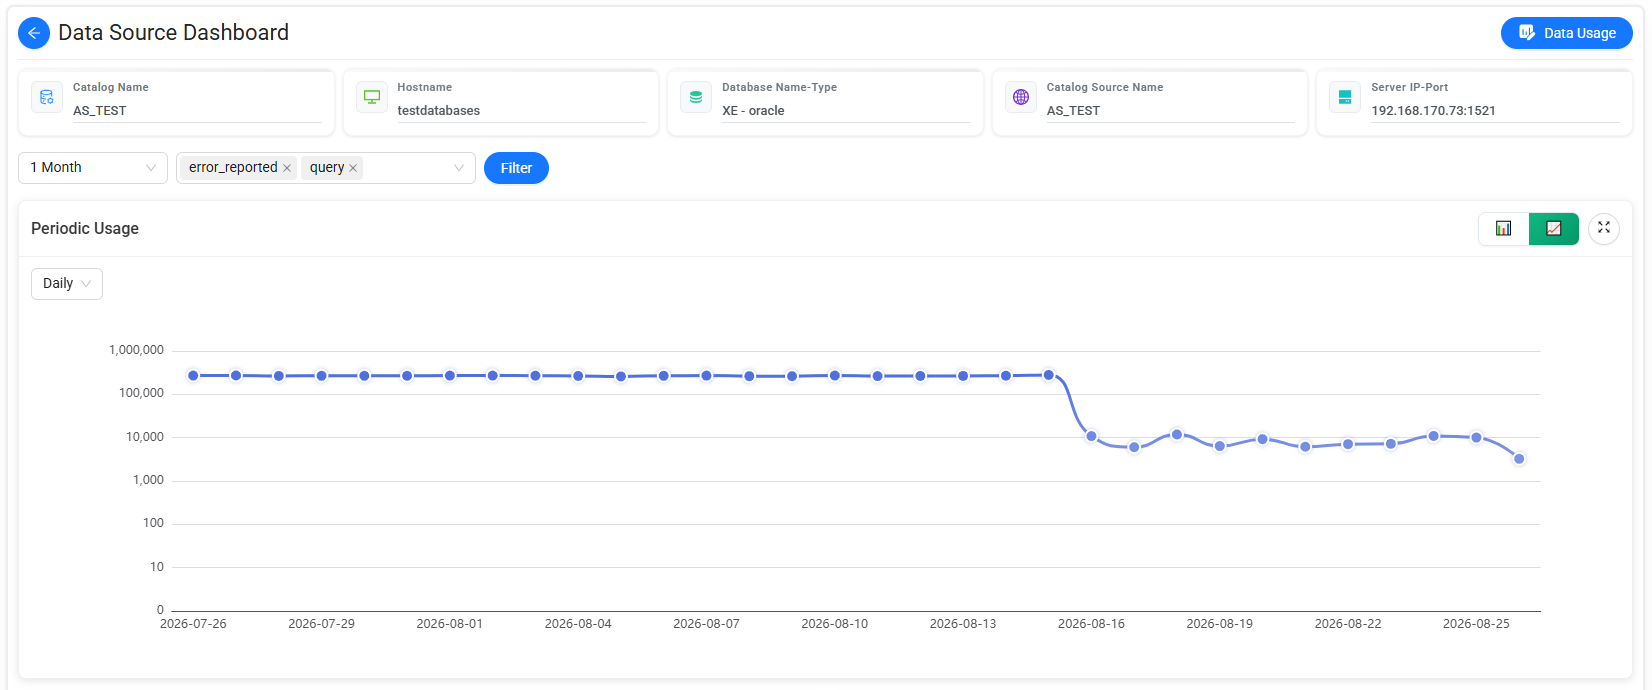
The Data Source Dashboard provides detailed information and analytics for the selected data source.
The dashboard includes information about:
- Periodic usage
- Sensitive and non-sensitive data counts
- Consumer queries
- Sensitive types
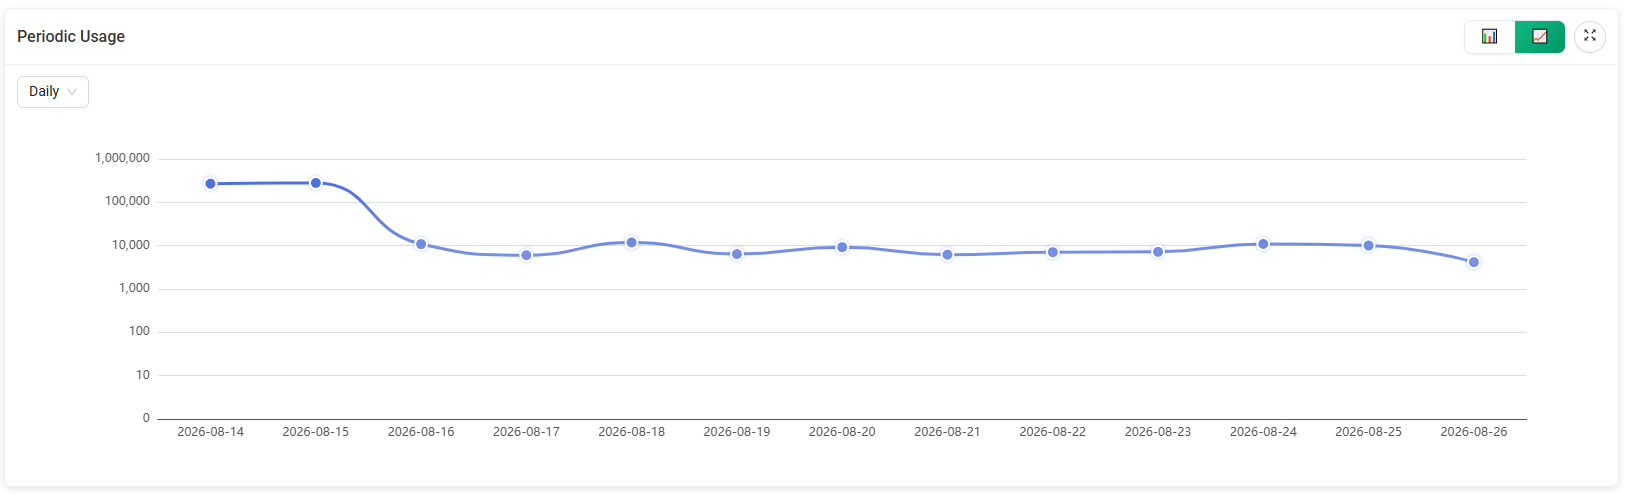
Periodic Usage
The Periodic Usage line chart shows total data source usage over time.
You can:
- Change the date range.
- Filter the results by catalog.
- Switch between Linear and Logarithmic scales.
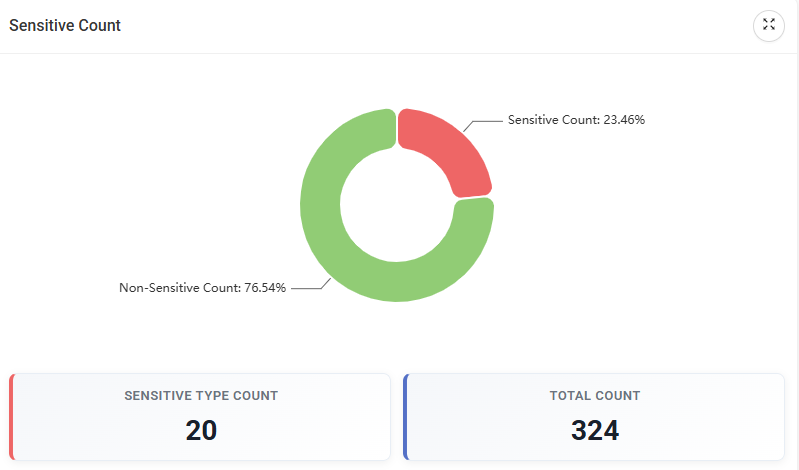
Sensitive Count
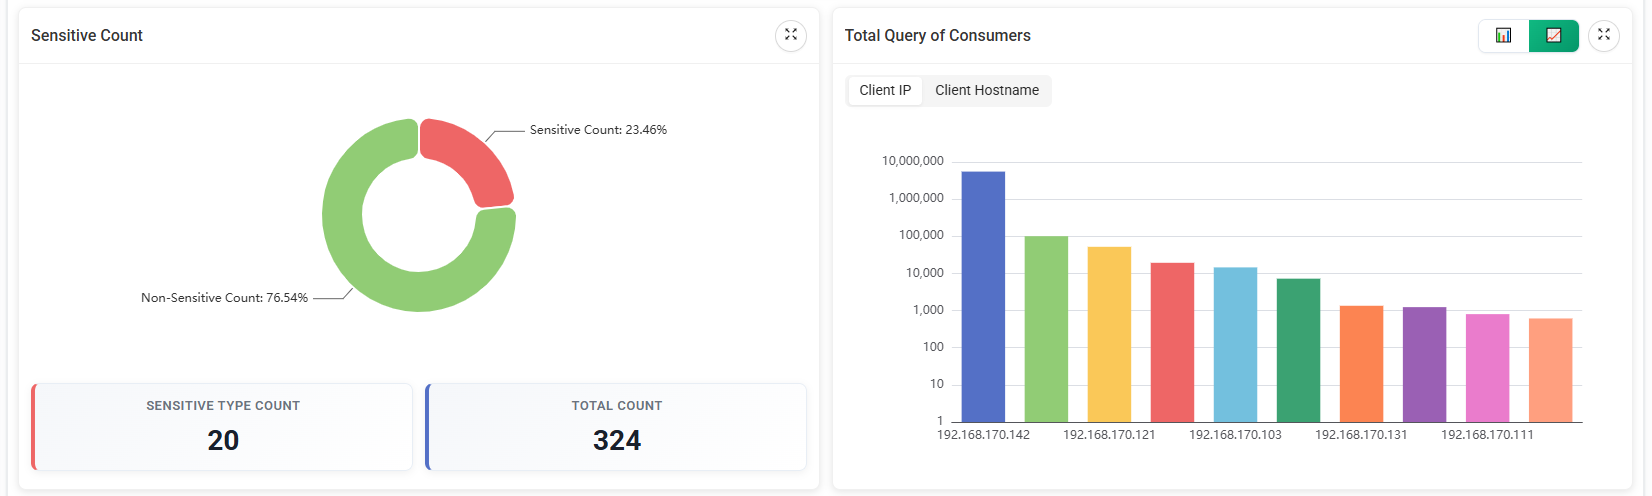
The Sensitive Count chart shows the distribution of sensitive and non-sensitive data.
The summary below the chart displays:
- The number of sensitive types.
- The total number of items.
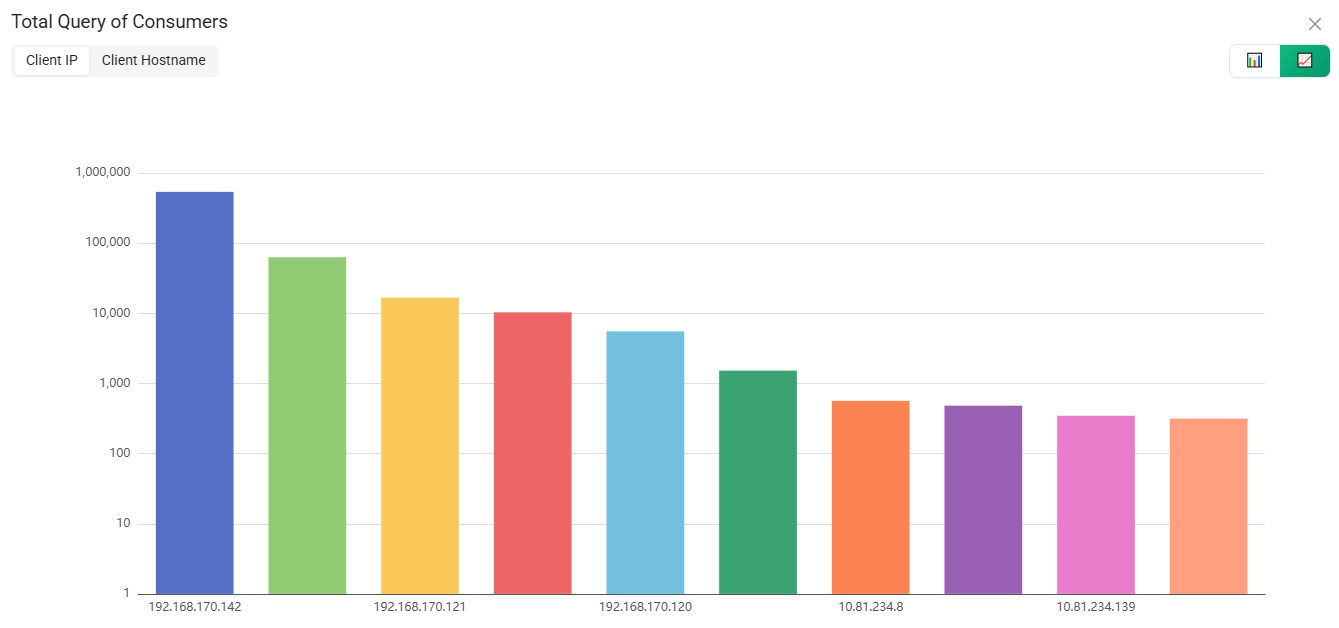
Total Query of Consumers
The Total Query of Consumers bar chart shows the total number of queries performed by consumers that accessed sensitive data.
You can group the query counts by:
- Client IP
- Client Hostname
Use the toggle to switch between Client IP and Client Hostname.
The chart displays the query count for each consumer directly on the corresponding bar. You can also switch between Linear and Logarithmic scales.
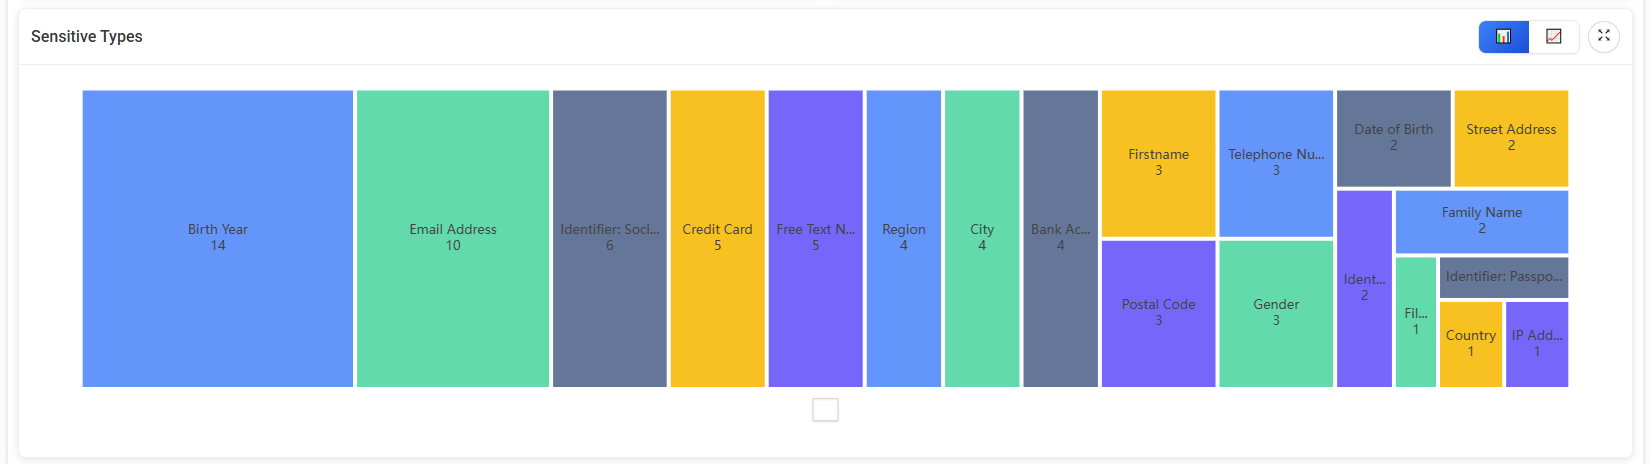
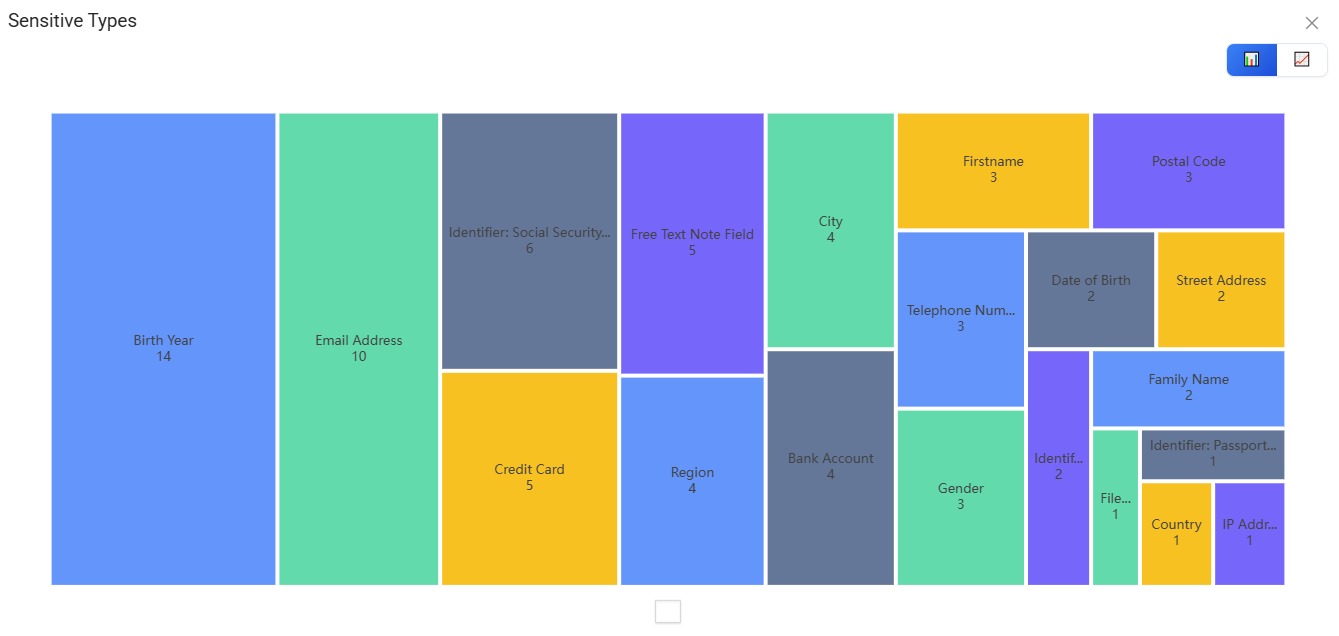
Sensitive Types
The Sensitive Types chart shows the detected sensitive types and their corresponding counts.
You can switch between Linear and Logarithmic scales to change how the values are displayed.
Data Usage
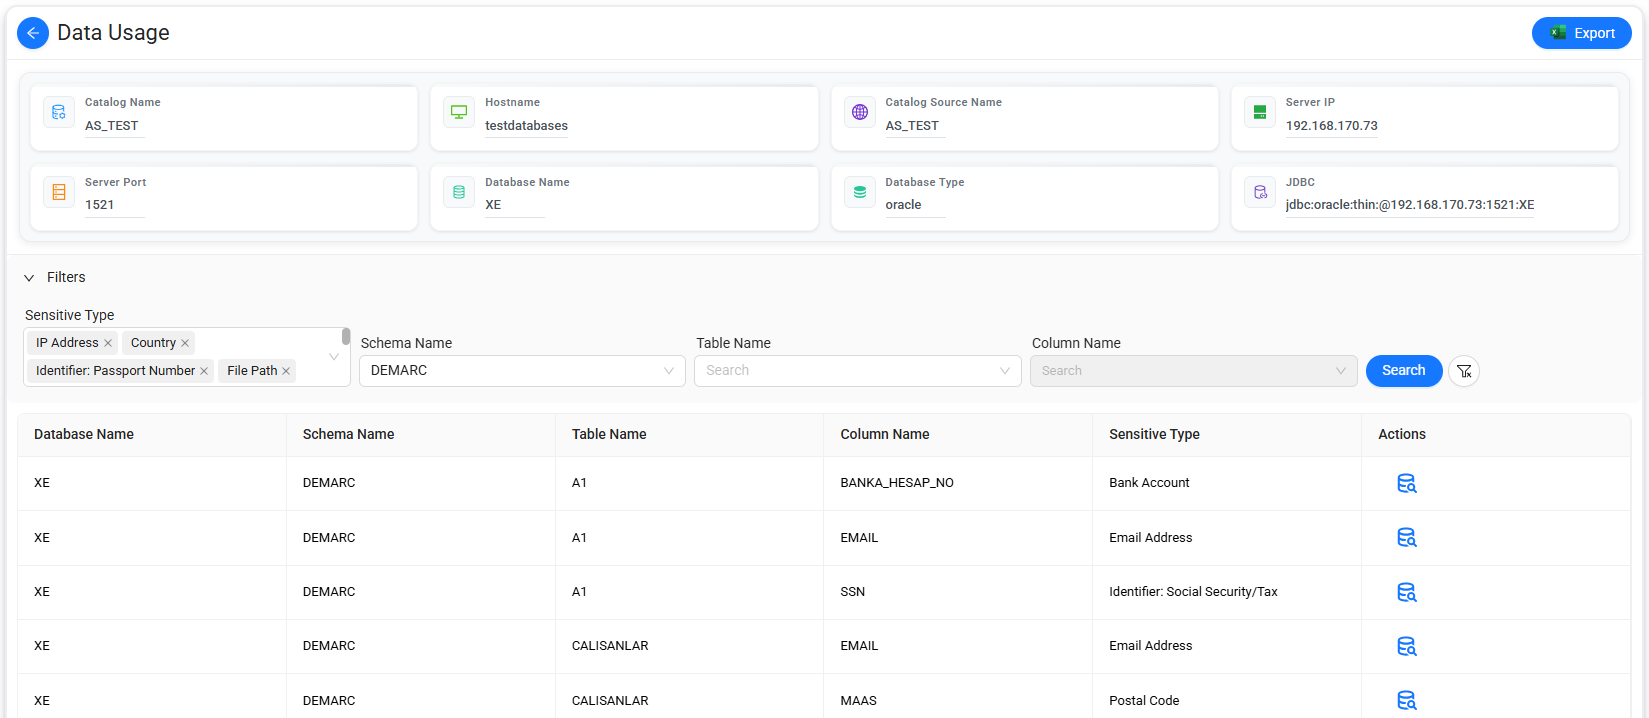
Select Data Usage on the Data Source Dashboard to view Data Activity Monitoring (DAM) information for the selected data source.
The Data Usage page provides access details and query-related information for the source environment.
The list includes the following information:
- Database Name
- Schema Name
- Table Name
- Columns
- Sensitive Types
You can filter the values in the list to narrow the displayed results.
To export the filtered results to an Excel file, select Export.
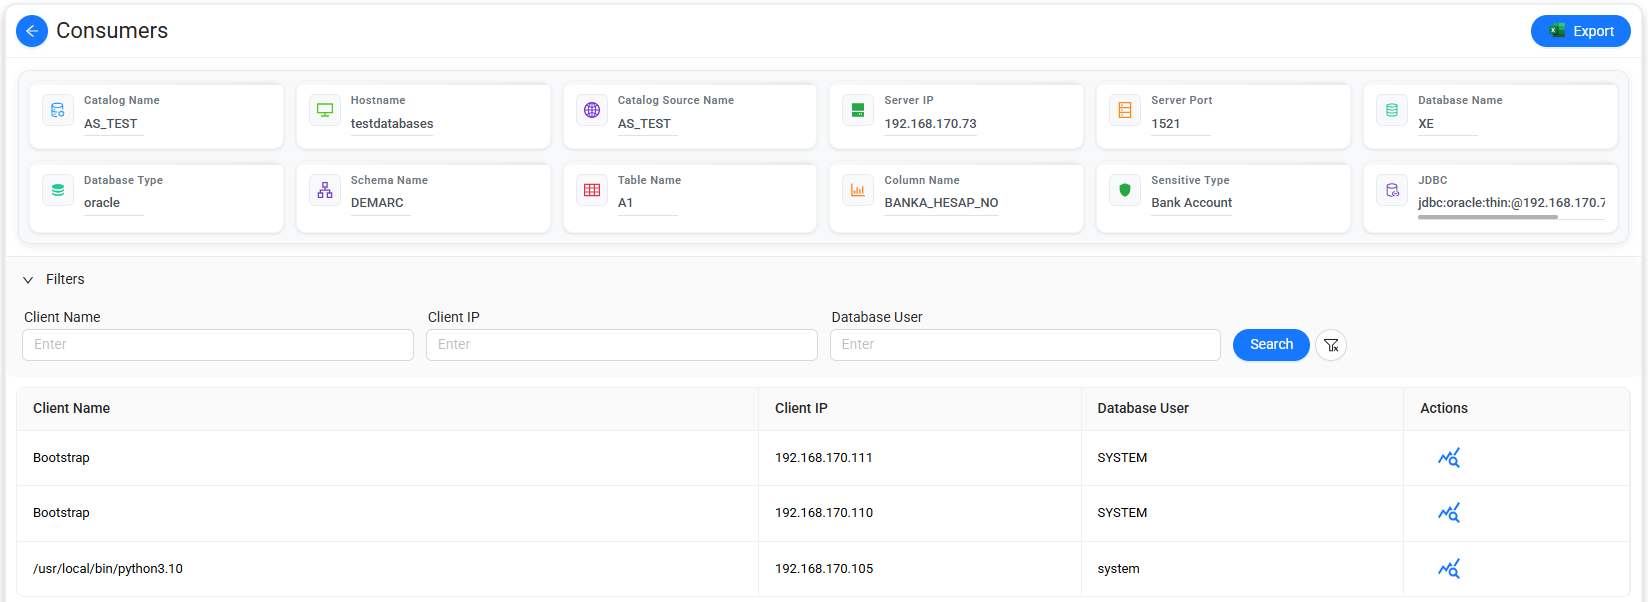
Retrieve consumer activity
On the Data Usage page, select  to open the Select Dates and Action window.
Use this window to define the time period and query actions to include in the results.
The following predefined date ranges are available:
- Three Days
- One Week
- 1 Month
- Custom Date
You can also select one or more Actions to filter the results by query type.
Note
If you do not select an action, Data Touch retrieves all available action types for the selected date range.
Based on the selected Date range and Actions, Data Touch displays detailed information about the queries performed by consumers during the specified period.
To export the displayed results to an Excel file, select Export.
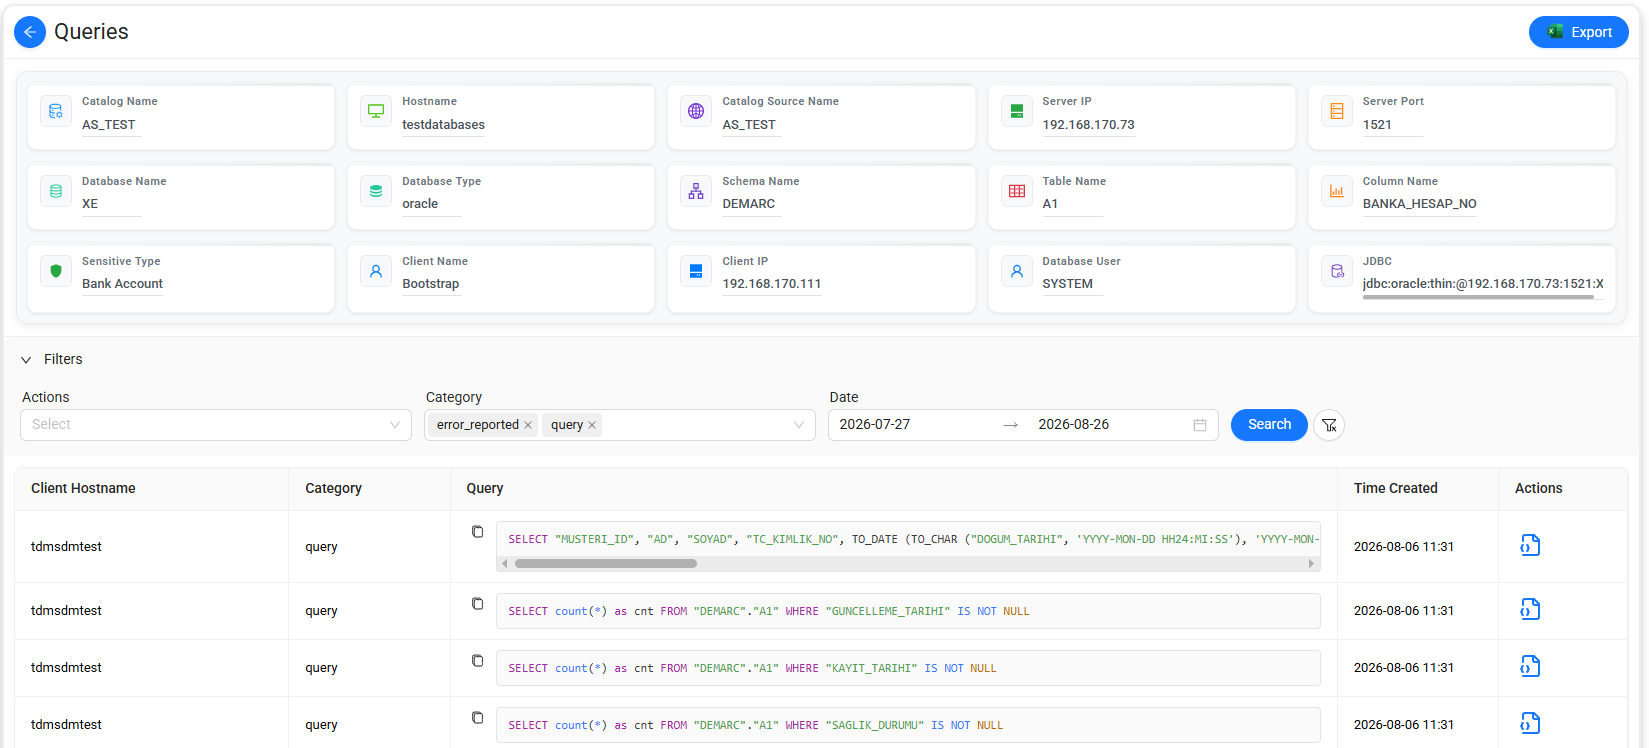
View query details
Select  for a consumer to view all queries associated with that consumer.
The query details are displayed as a list.
To export the displayed query details to an Excel file, select Export.
To copy a query, select  next to the relevant query.
Query Details
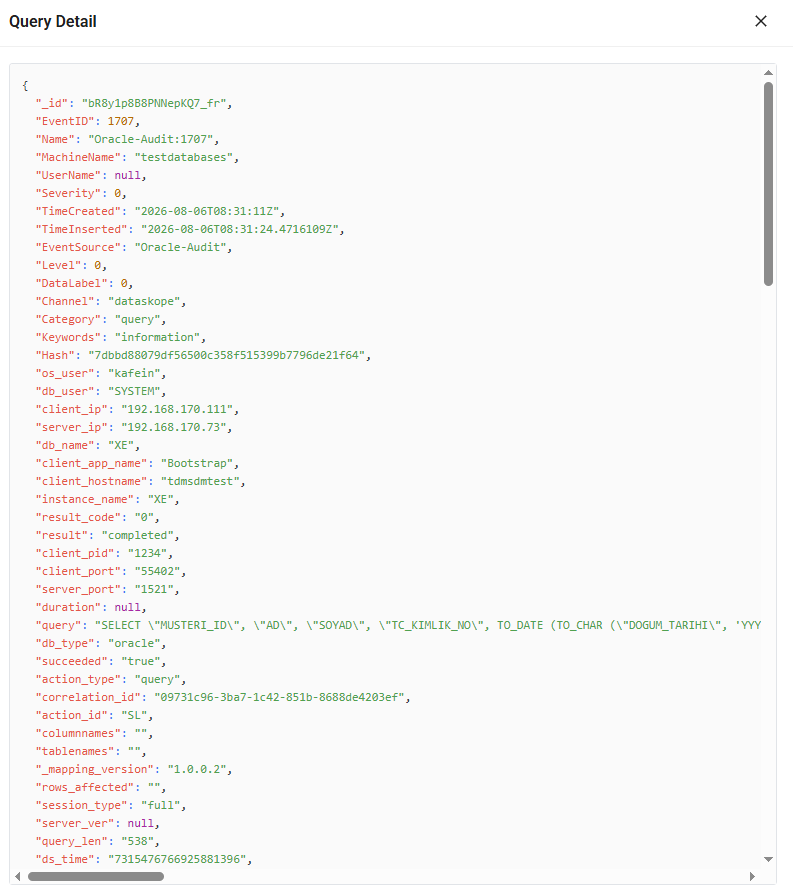
Select  to view detailed information about a query.